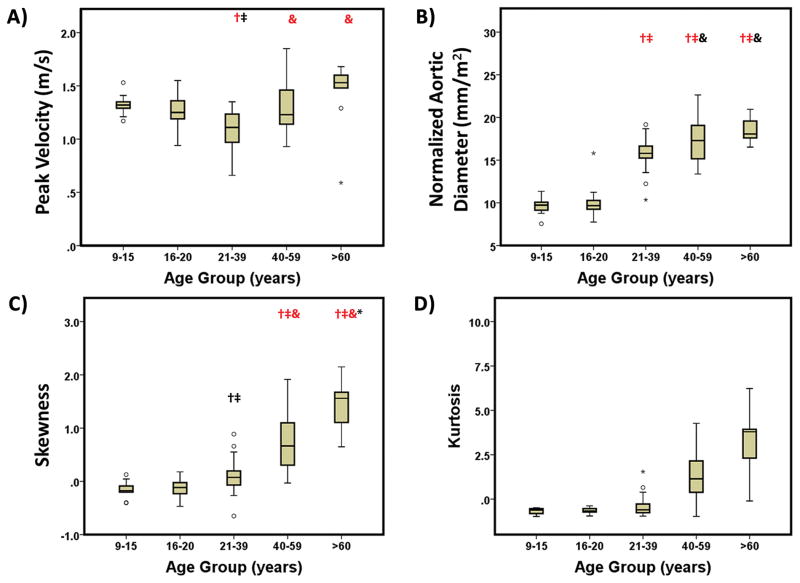
FIGURE 6. Comparison of age groups for aortic peak velocity magnitude, normalized aortic diameter, skewness and kurtosis.
Outliers, circles, were defined by 1.5 × interquartile range. Extreme values, stars, were defined by 3 × interquartile range. : Black (P<0.05) and red (P<0.001) as compared with group 1 (9–15 years). : Black (P<0.05) and red (P<0.001) as compared with group 2 (16–20 years). &: Black (P<0.05) and red (P<0.001) as compared with group 3 (21–39). *: Black (P<0.05) and red (P<0.001) as compared with group 4 (40–59 years).

