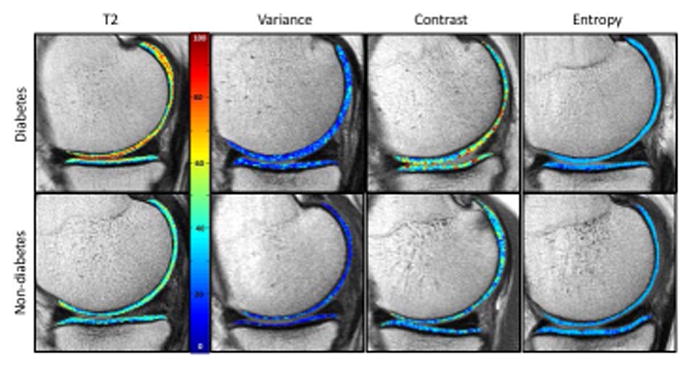
Figure 4.

Sagittal T2 color maps as well as the corresponding texture maps (variance, contrast and entropy) of the medial compartment of the right knee of a subject with diabetes mellitus and a matched subject without diabetes mellitus. On the T2 maps, blue color indicates low, while red color high cartilage T2 values. Cartilage of diabetic subject showed elevated T2 relaxation time compared to the subject without diabetes mellitus. The corresponding texture maps show a wider range of values, displayed through colors, in the subject with compared to the subject without diabetes. Again these findings are compatible with severer cartilage matrix degeneration of the subject with diabetes mellitus compared to the subjects without diabetes mellitus.
