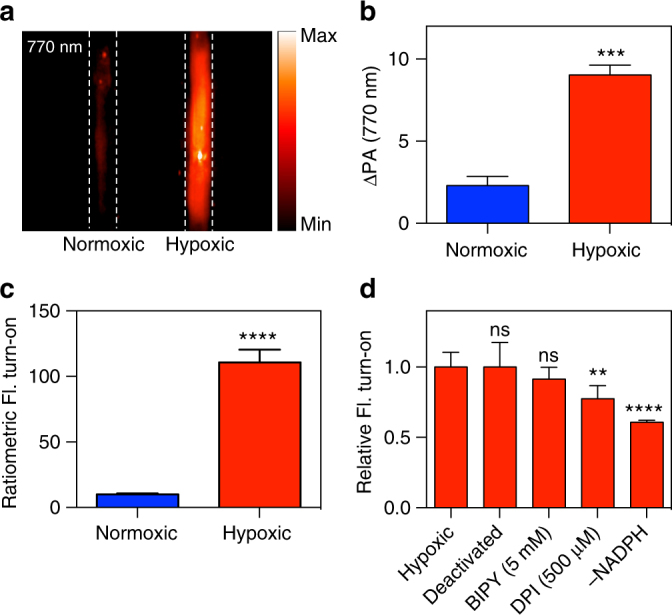
Fig. 4.

Hypoxia-selective response of HyP-1 in vitro. a Representative PA image (770 nm) of reaction mixtures incubated under normoxic or hypoxic conditions for 2 h, then quenched with an equal volume of acetonitrile. Dashed lines indicate positioning of FEP tubes. b Change in PA signal (770 nm) produced after 2 h incubation of HyP-1 (10 μM) with rat liver microsomes (RLM) (200 μg/mL) and NADPH (50 μM) in normoxic and hypoxic conditions (n = 3). c Ratiometric fluorescence turn-on after 2 h incubation of HyP-1 (2 μM) with RLM (200 μg/mL) and NADPH (50 μM) in normoxic or hypoxic conditions (n = 3). d Normalized fluorescent turn-on after 1 h hypoxic incubation of HyP-1 (2 μM) with RLM (100 μg/mL) and NADPH (50 μM) under various conditions. Statistical significance represents a comparison to the hypoxic control (n = 6). Results with error bars are represented as mean ± SD. **p < 0.01, ***p < 0.001, ****p < 0.0001
