Fig. 7.

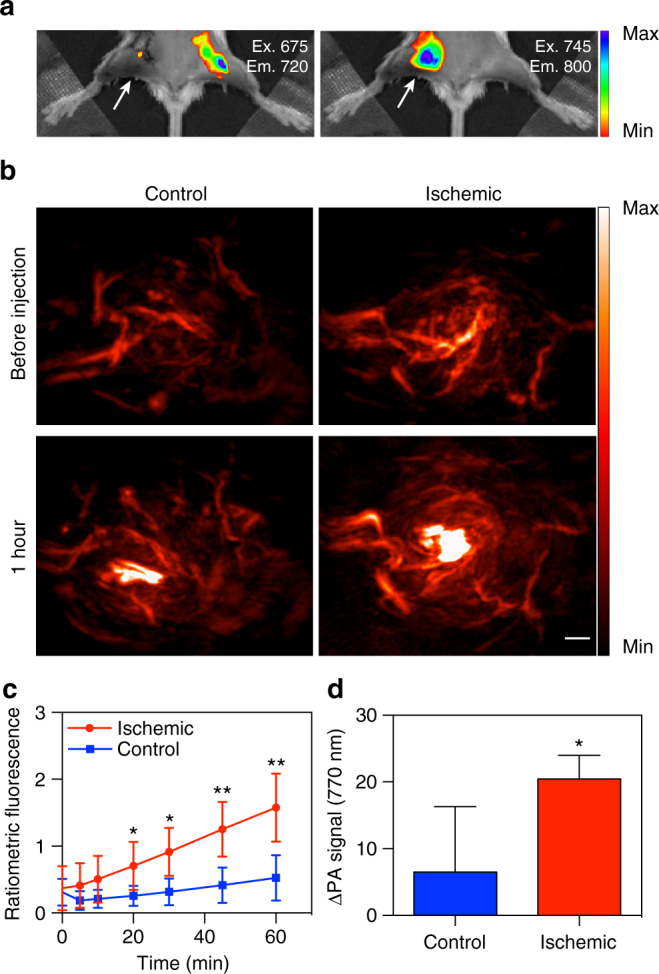
In vivo imaging of a murine hindlimb ischemia model with HyP-1. a Fluorescence (IVIS spectrum) images acquired of hindlimb ischemia mouse model (right leg) 1 h following intramuscular injection (50 μL, 50 μM) of HyP-1 in both legs. Images were acquired using 675/720 nm and 745/800 nm filter sets. Mouse imaged in supine position, arrows indicate ischemic tissue. b PA images (770 nm) of the ischemic and control leg before and 1 h following injection of HyP-1 (50 μL, 50 μM). Scale bar represents 2 mm. c Time-dependent ratiometric fluorescence increase of ischemic and control limbs (n = 5). d Time-dependent increase of PA signal of ischemic and control limbs (n = 4). Results with error bars are represented as mean ± SD. *p < 0.05, **p < 0.01
