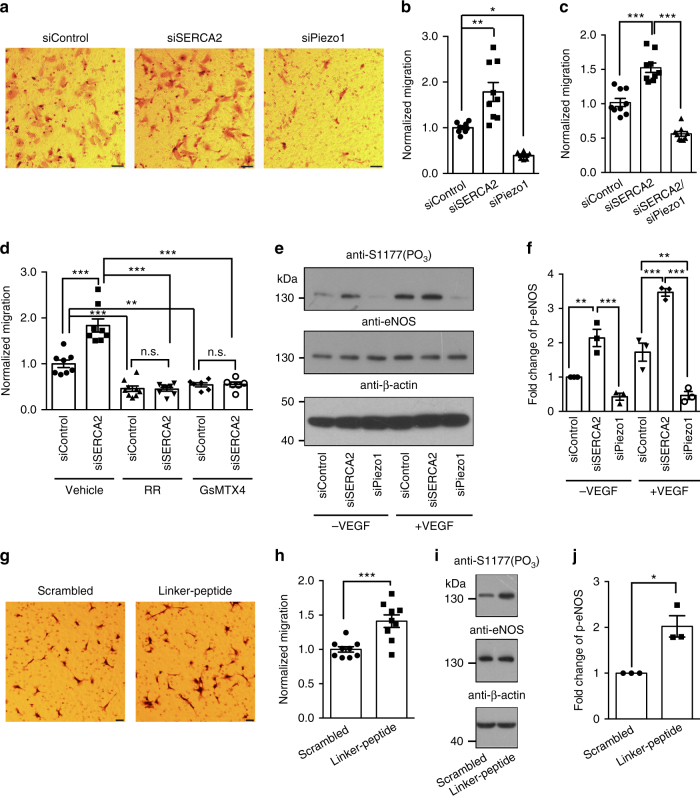
Fig. 6.
Regulation of Piezo1-dependent mechanotransduction processes by SERCA2 in HUVEC. a and g, Representative images showing the migrated HUVEC cells in the transwell assay. Scale bar, 50 μm (a) or 20 μm (g). b, c, d, and h, Scatter plots of the normalized migration ability of HUVEC under the indicated conditions. One-way ANOVA with Turkey’s multiple comparison test (b, c, d) or unpaired student’s t-test (h). e and i, Western blotting shows the phosphorylation at S1177 of the eNOS protein under the indicated conditions. f and j, Scatter plot of the normalized fold change of phosphorylated-eNOS under the indicated conditions. Data shown as mean ± s.e.m. * p < 0.05, ** p < 0.01, ***p < 0.001

