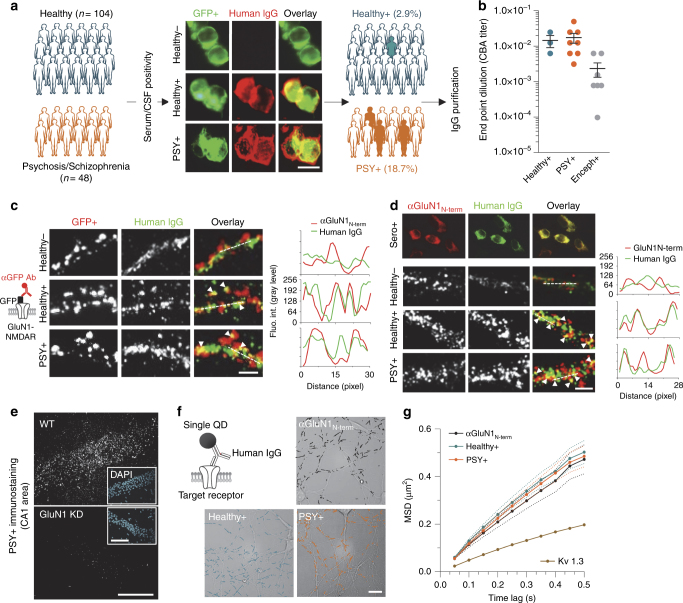
Fig. 1.
Multi-approach identification of NMDAR-Ab IgG in the serum of schizophrenia patients and healthy subjects. a Immunostaining of HEK293 cells expressing GluN1-GFP and GluN2B subunits labeled with the sera of healthy subjects or schizophrenic patients (1/10, 3 h incubation). Note the overlap between serum reactivity (red) and GFP-positive HEK cells (green) for seropositive samples. Scale bar, 10 µm. b Mean ± SEM of NMDAR-Ab titers estimated by end-point dilutions for Healthy + (n = 3 samples), PSY + (n = 8) and Enceph + (n = 7) serum samples. Each data point represents the value calculated for a subject or a patient. c Surface co-immunostaining for GluN1-SEP containing NMDAR (red) and human purified IgG’s target (green) in live hippocampal neurons. Both Healthy + and PSY + IgG detect a target that colocalizes with surface GluN1-SEP clusters (white arrowheads). Scale bar, 2 µm. Right panel: corresponding linescans plotting GFP + and human IgG fluorescence intensities over distance (pixel). d Upper panel: surface co-immunostaining of HEK293 cells with a commercial anti-GluN1 antibody targeting the extracellular part of the GluN1 subunit and seropositive samples. Lower panel: representative dendritic areas of cultured hippocampal neurons (12 div) co-labeled with purified IgG (5 µg ml−1, green) from Healthy −, Healthy +, or PSY + subjects and a commercial anti-GluN1 antibody targeting the extracellular part of the GluN1 subunit (αGluN1N-term, red). Scale bar, 2 µm. Right panel: corresponding linescans plotting endogenous GluN1-NMDAR and human IgG fluorescence intensities over distance (pixel). e Immunostaining of CA1 hippocampal sections (20 µm thick) with PSY + IgG from wild-type (WT) and GluN1 knock-down (GluN1-KD) mice. Insets, DAPI staining (blue). Scale bar, 200 µm; scale bar inset, 100 µm. f Representative trajectories obtained with αGluN1N-term (black lines), Healthy + (blue) and PSY + (orange) IgG-QD complexes used to label the surface target of patients’ IgG. IgG-QD complexes were tracked during 500 frames with a 50ms acquisition frequency on cultured hippocampal neurons (14–15 div). Scale bar, 20 µm. g Mean Square Displacement (MSD) over time of endogenous GluN1-NMDAR targeted by a commercial αGluN1N-term antibody (n = 5 neurons) or using purified IgG from Healthy + (n = 6) or PSY + (n = 10) individuals. The curves are represented as mean ± SEM (dash lines)

