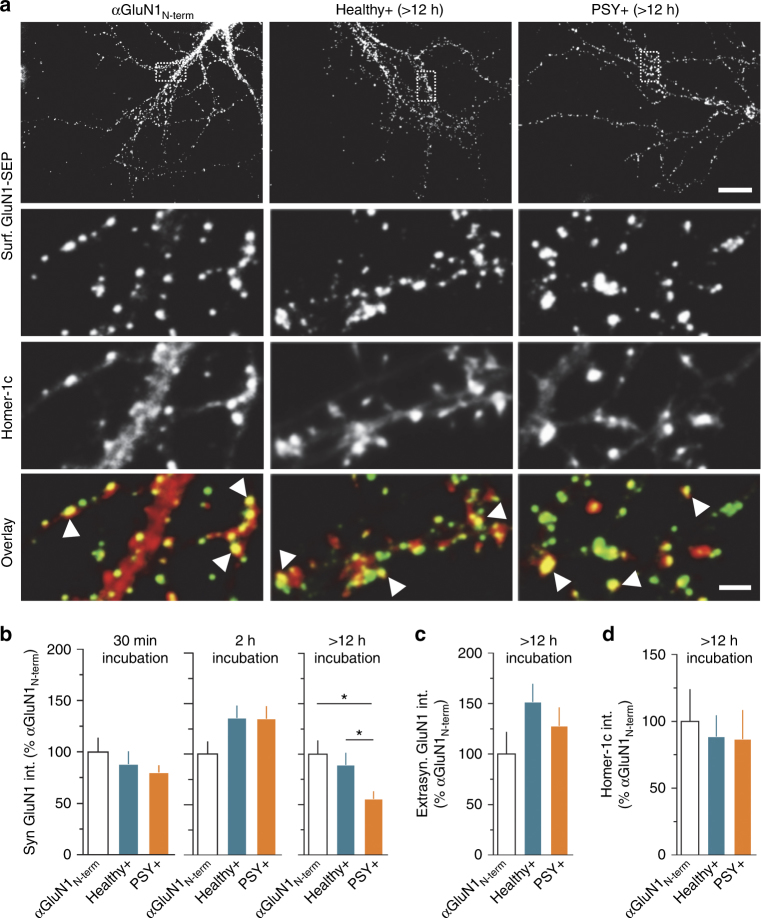
Fig. 5.
PSY + NMDAR-Ab specifically alter NMDAR synaptic content in a time-dependent manner. a Live staining of GluN1-SEP in hippocampal cultures treated overnight with either a control antibody (αGluN1N-term) or human purified IgG (Healthy + or PSY + NMDAR-Ab). The synaptic localization of NMDAR clusters (green) was determined using Homer-1c (red). Colocalized staining was interpreted as synaptic GluN1-NMDAR clusters (white arrowheads). Three out of three Healthy + and four out of nine PSY + samples were used and pooled for comparisons. Scale bar, 20 µm (upper panels), 2 µm (lower panels). b Normalized synaptic GluN1-NMDAR fluorescence intensity (normalization to the control condition αGluN1N-term) after incubation with αGluN1N-term (n = 19 neurons), Healthy + (n = 36), or PSY + (n = 55) for 30 min (P = 0.7604, one-way ANOVA); after incubation with αGluN1N-term (n = 24), Healthy + (n = 47) or PSY + (n = 77) for 2 h (P = 1.389, one-way ANOVA), or after incubation with αGluN1N-term (n = 22), Healthy + (n = 34) or PSY + (n = 28) for 12 h. Synaptic NMDAR fluorescence intensity is reduced after a 12 h exposure to PSY + NMDAR-Ab (*P < 0.05, one-way ANOVA followed by Tukey’s multiple comparison test). c Normalized extrasynaptic GluN1-NMDAR fluorescence intensity after 12 h incubation with αGluN1N-term (n = 14 neurons), Healthy + (n = 34), or PSY + (n = 30) NMDAR-Ab (P = 0.2385, Kruskal–Wallis test). d Normalized Homer-1c fluorescence intensity after a 12 h incubation with αGluN1N-term (n = 25 neurons), Healthy + (n = 31), or PSY + (n = 16) NMDAR-Ab (P = 0.1073, one-way ANOVA)

