Fig. 6.
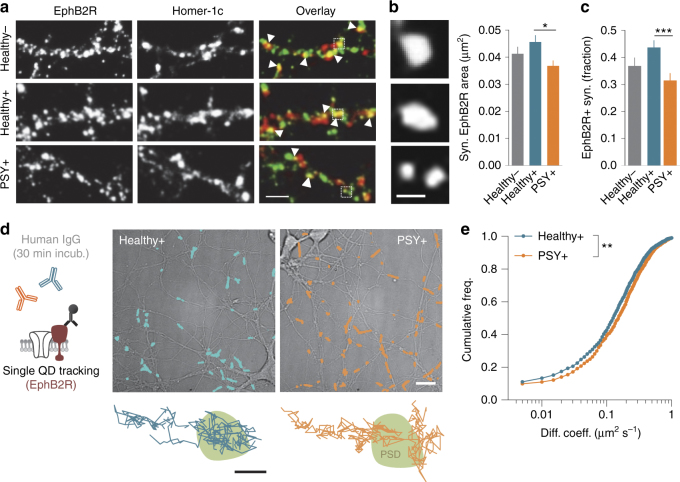
Synaptic EphB2R diffusion and distribution are specifically altered by PSY + NMDAR-Ab. a Immunostaining of surface EphB2R in hippocampal neurons (12 div) exposed to purified IgG from Healthy −, Healthy +, or PSY + samples for 12 h. One out of one Healthy − , three out of three Healthy +, and four out of nine PSY + samples were used and pooled for comparisons. Synaptic EphB2R were determined as overlapping clusters with the synaptic marker Homer-1c (white arrowheads). Scale bar, 2 µm. b Left panel: synaptic EphB2R clusters after a 12 h exposure to Healthy −, Healthy +, or PSY + purified IgG. Scale bar, 500 nm. Right panel: mean ± SEM of synaptic EphB2R clusters area exposed to Healthy − (n = 24 neurons), Healthy + (n = 49), or PSY + (n = 40) purified IgG. Exposure to PSY + NMDAR-Ab for 12 h reduces the area of synaptic EphB2R clusters (*P = 0.0359, Kruskal–Wallis test followed by Dunn’s multiple comparison test). c Fraction of EphB2R-positive synapses after incubation with Healthy − (n = 25 neurons), Healthy + (n = 49), or PSY + (n = 41) purified IgG. PSY + NMDAR-Ab affect the proportion of synaptic EphB2R (***P < 0.001, Kruskal–Wallis test followed by Dunn’s multiple comparison test). d Surface live tracking of endogenous EphB2R in hippocampal neurons (15 div) exposed to Healthy + or PSY + NMDAR-Ab for 30 min. Scale bar, 20 µm. Bottom panel: Representative EphB2R single trajectories within PSD areas. Scale bar, 500 nm. e Cumulative distributions of the instantaneous diffusion coefficient of synaptic EphB2R in the presence of Healthy + (n = 1,432 trajectories, N = 33 neurons) or PSY + NMDAR-Ab (n = 1104, N = 39). The distribution is shifted toward the right after exposure to PSY + NMDAR-Ab (**P < 0.01, Kolmogorov–Smirnov test)

