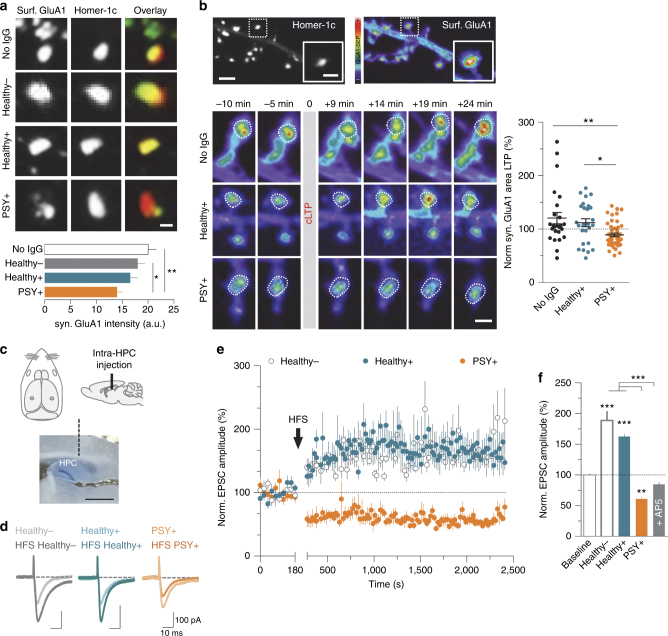
Fig. 8.
PSY + NMDAR-Ab prevent LTP expression through an alteration of basal and activity-dependent recruitment of synaptic AMPAR. a Live immunostaining of surface GluA1-SEP clusters (12 div) in control condition (No IgG) or after a 12 h incubation with purified IgG (5 µg ml−1) from Healthy −, Healthy +, or PSY + subjects. Scale bar, 500 nm. Bottom panel: mean ± SEM of synaptic GluA1-AMPAR fluorescence intensity in control condition with no IgG (n = 74 dendritic regions, N = 24 neurons) or after exposure to Healthy − (n = 41, N = 10), Healthy + (n = 52, N = 16), or PSY + NMDAR-Ab (n = 74, N = 20). **P = 0.0042, Kruskal–Wallis test. b Impact of NMDAR-Ab on chemically induced long-term potentiation (cLTP) of synaptic AMPAR. The pseudocolor representation codes for GluA1-SEP fluorescence intensity levels. Scale bar, 20 µm; scale bar inset, 1 µm. Bottom panel: time course of GluA1-SEP fluorescence in a synaptic area (white dashed line) after a cLTP stimulus with Healthy + or PSY + NMDAR-Ab (5 µg ml−1). Scale bar, 1 µm. Right panel: normalized synaptic GluA1-AMPAR clusters area 19–24 min after application of the cLTP stimulus with no IgG (n = 25 neurons), Healthy + (n = 26), or PSY + NMDAR-Ab (n = 46). Data are expressed as mean ± SEM. **P = 0.016, one-way ANOVA. c Schematic description of the stereotaxic injection of purified IgG (5 µg ml−1) into the dorsal hippocampus of P12–P15 rats. Scale bar, 1 mm. d Representative EPSC traces recorded during baseline or 35–40 min after the high-frequency stimulation (HFS) protocol following injection of purified IgG from Healthy − (one out of one subject), Healthy + (pool of three out of three samples), and PSY + (pool three out of nine samples) individuals. e Average time course of HFS-induced LTP. Normalized EPSC amplitudes (normalization to the mean amplitude of EPSCs recorded during baseline acquisition) are plotted against time for Healthy − (n = 8 neurons), Healthy + (n = 10), and PSY + (n = 9) conditions. Data are presented as mean ± SEM. f Mean ± SEM of normalized EPSC amplitudes at baseline or 35–40 min after application of the pairing protocol in Healthy − (n = 8), Healthy + (n = 10), PSY + (n = 9), or D-AP5 (n = 5) conditions. ***P < 0.0001; one-way ANOVA

