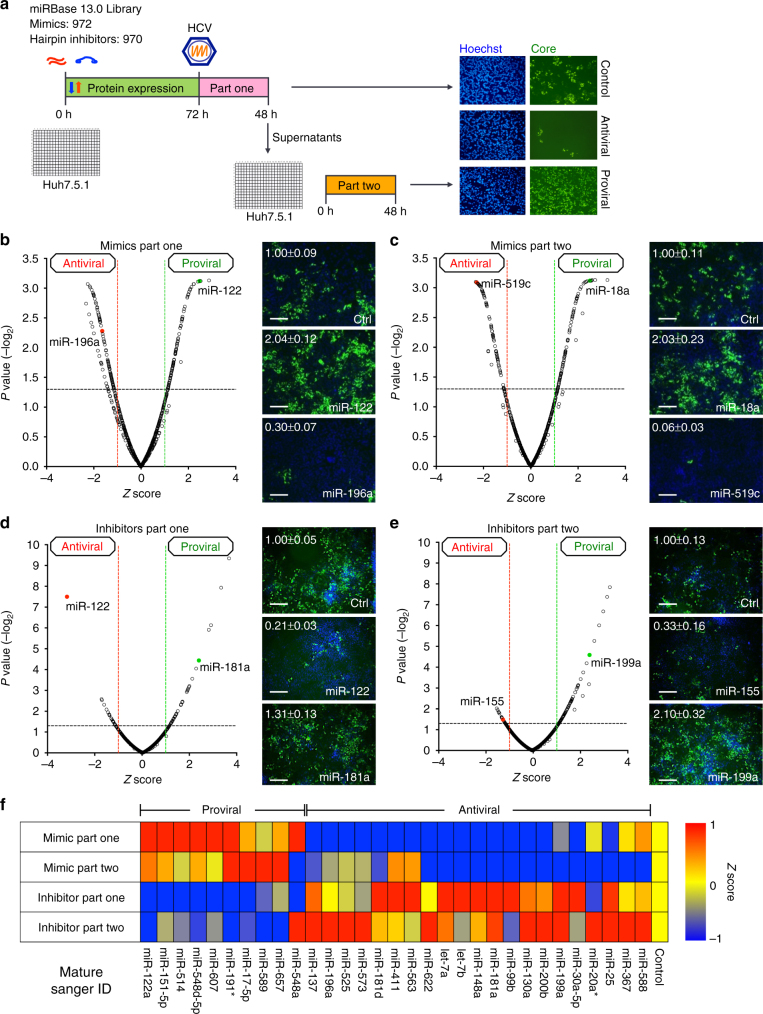
Fig. 1.
Integrative functional screens identify cellular miRNAs modulating HCV infection. a Schematic of the primary screen. b–e Volcano plots showing Z scores and P values (−log2 scale, Student’s t test) from miRNA mimics in part one (b) and part two (c), and inhibitors in part one (d) and part two (e) of the HCVcc screen. Representative images and quantitative analyses of HCV core staining in cells transfected with select miRNA mimics or inhibitors, as indicated, are shown beside the volcano plots. Green, HCV core; blue, cell nuclei. Scale bars, 100 μm. Numbers represent the percentages of core staining-positive cells (the mean ± SD, n = 3). Ctrl, miRNA mimic or inhibitor negative control. f Heatmap eliciting Z scores for primary screen hits with opposite mimic and inhibitor phenotypes. Z scores in the heatmap are depicted in a continuum from blue (reduced infection—antiviral) to red (enhanced infection—proviral)

