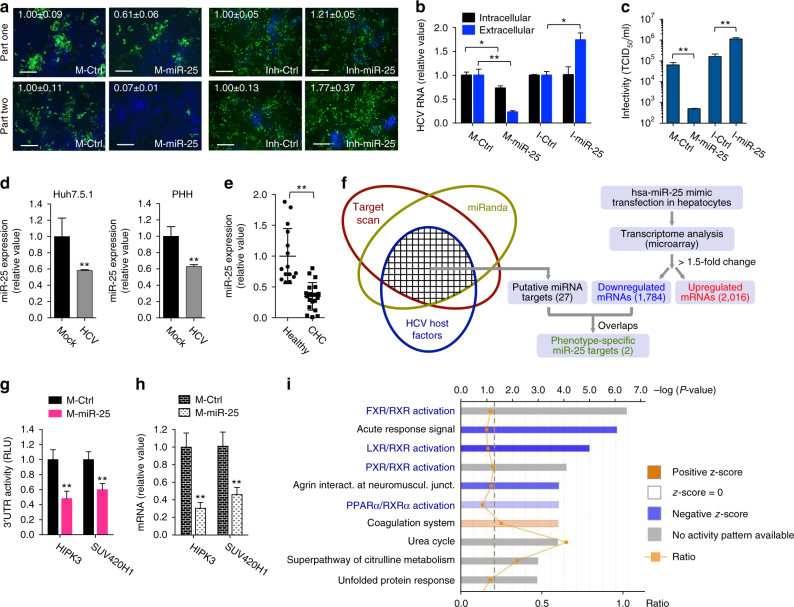
Fig. 4.
miR-25 restricts the late stages of HCV infection. a–c Effects of miR-25 mimic or hairpin inhibitor on production of HCV core protein (a), viral RNA (b), and infectious HCV (c). The mimic and inhibitor exerted opposite phenotypes in Huh7.5.1 cells. Compared with part-one core staining (a) and intracellular HCV RNA levels (b), more profound inhibitory effects were seen in part-two core staining (a) and in the level of secreted HCV RNA (b). (a) Green, HCV core; blue, nuclei. Scale bars, 100 μm. (d) HCV infection downregulates miR-25 expression in Huh7.5.1 cells and PHH, examined by qPCR gene expression assays. e Hepatic abundance of miR-25 is significantly lower in the livers of CHC patients compared to those of healthy controls, measured by qPCR. Each dot represents one individual’s liver tissue. f Schematics for systematic identification of potential miR-25 targets. Bioinformatics-based target prediction, in line with assessing phenotypic effects on HCV infection and global transcriptome analysis, derived two phenotypic-specific miR-25 target candidates. g, h miR-25 mimic transfection abates 3′-UTR activities (g) and mRNA levels (h) of HIPK3 and SUV420H1. i Bioinformatics analysis of miR-25 targeted molecular pathways, derived from microarray-based transcriptome dataset comparing miR-25 mimic-transfected cells with mimic control-treated cells (Supplementary Data 7). Ingenuity Pathway Analysis (IPA, QIAGEN) was implemented to analyze all genes significantly downregulated by miR-25 mimic treatment, identifying various enriched pathways, as shown, that significantly correlate with miR-25 overexpression. All values are normalized relative to Ctrl, and error bars represent SD of the mean, n = 3 (a–d, h) or 5 (g). *P < 0.05, **P < 0.01 determined by Student’s t-test

