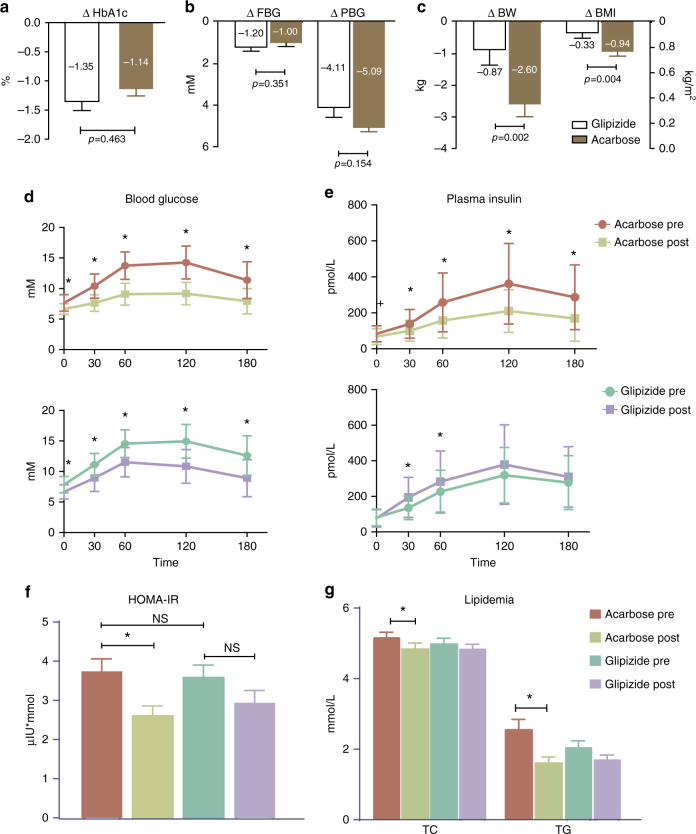
Fig. 1.
Major clinical outcomes in patients after 3 months of treatment with Acarbose or Glipizide. a Effect on glycated haemoglobin A1c (HbA1c), in the Acarbose (brown) and Glipizide (white) arms, Wilcoxon rank-sum test. b Effects on fasting blood glucose concentration (FBG), postprandial blood glucose concentration (PBG) in the Acarbose (brown) and Glipizide (white) treatment arms; paired Wilcoxon rank-sum test, *P < 0.01. c Effects on body weight (BW) and body mass index (BMI) in the Acarbose (brown) and Glipizide (white) treatment arms. d Blood glucose excursion curve and e plasma insulin release curve during the meal tests in the two treatment arms, paired Wilcoxon rank-sum test, *P < 0.01, + P < 0.05, pre-treatment vs. post-treatment with Acarbose. f Effects on HOMA-IR, g Total cholesterol (TC) and triglycerides (TG) in the two treatment arms; paired Wilcoxon rank-sum test, *P < 0.01. n = 51 in Acarbose pre and Acarbose post-treatment, n = 43 in Glipizide pre and Glipizide post-treatment

