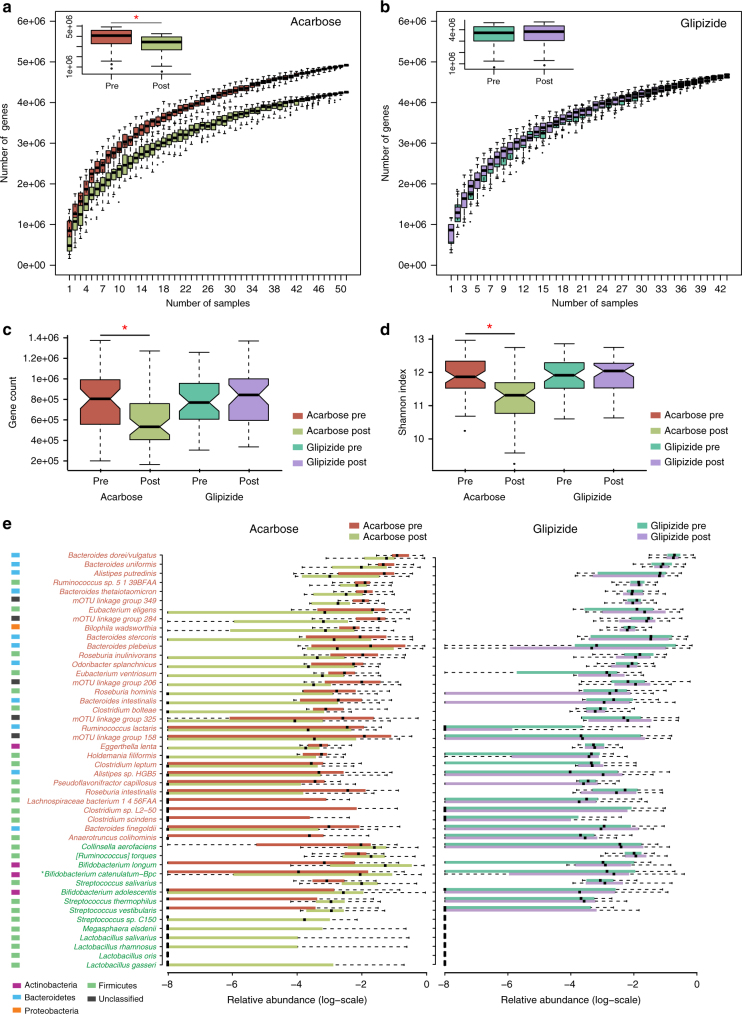
Fig. 3.
Acarbose elicits stronger impact on the gut microbiota than Glipizide. Effects of Acarbose a and Glipizide b treatments on gene rarefaction, n = 51 in Acarbose pre and Acarbose post-treatment, n = 43 in Glipizide pre-treatment and Glipizide post-treatment. All bar plots are shown as mean ± S.D. The number of genes in each group was calculated after 100 random samplings with replacement. The effects of treatment in both arms on gene richness c and Shannon index d of the gut microbiome, n = 51 in Acarbose pre and Acarbose post-treatment, n = 43 in Glipizide pre and Glipizide post-treatment. e mOTUs significantly changed in abundance by Acarbose treatment (left panel), Benjamini–Hochberg q-value < 0.01, presented in box-plots to illustrate the relative abundances of the different groups. The mOTUs are listed in the order of their relative abundances pre-treatment. mOTUs in red represent mOTUs that decreased in abundance are after Acarbose treatment, whereas mOTUs that increased in abundance are given in green. The phylum colour code is indicated to the left of the mOTU annotation. The same mOTUs did not change after Glipizide treatment (right panel of e). All plotted boxes are interquartile ranges. Dark lines in the boxes indicate medians, the lowest and highest values within 1.5 times IQR from the first and third quartiles. Outliers are shown as circles beyond the whiskers. n = 51 in Acarbose, n = 43 in Glipizide, *Bifidobacterium catenulatum−Bpc: Bifidobacterium catenulatum-Bifidobacterium pseudocatenulatum complex

