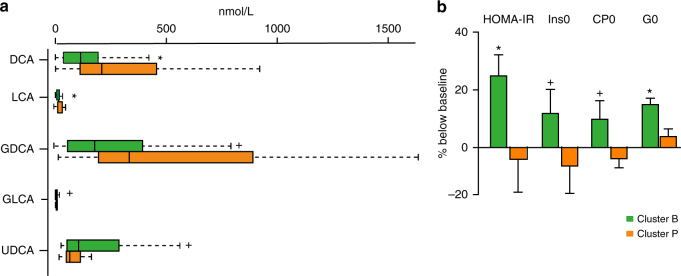
Fig. 5.
Plasma bile acid composition and therapeutic responses to Acarbose treatment differ in patients with a different baseline microbiota composition. a Plasma composition of bile acids in patients belonging to baseline enterotype-like clusters driven by Bacteroides (Cluster B) or Prevotella (Cluster P). Plasma levels of DCA, LCA, GDCA, GLCA and UDCA differed significantly between Cluster B and Cluster P at the baseline; plotted boxes are interquartile ranges. Dark lines in the boxes indicate medians, the lowest and highest values within 1.5 times IQR from the first and third quartiles, Wilcoxon rank-sum test, *P < 0.01, + P < 0.05. DCA deoxycholic acid, LCA lithocholic acid, GDCA glycodeoxycholic acid, GLCA glycolithocholic acid, UDCA ursodeoxycholic acid. b Percentage changes over baseline levels of fasting blood glucose (G0), insulin (Ins0), C peptide (CP0) and HOMA-IR differed significantly between Cluster B and Cluster P after Acarbose treatment; paired Wilcoxon rank-sum test, *P < 0.01, +P < 0.05. Cluster B, n = 36, Cluster P, n = 15 in Acarbose arm, bar plot is shown as mean ± S.D.

