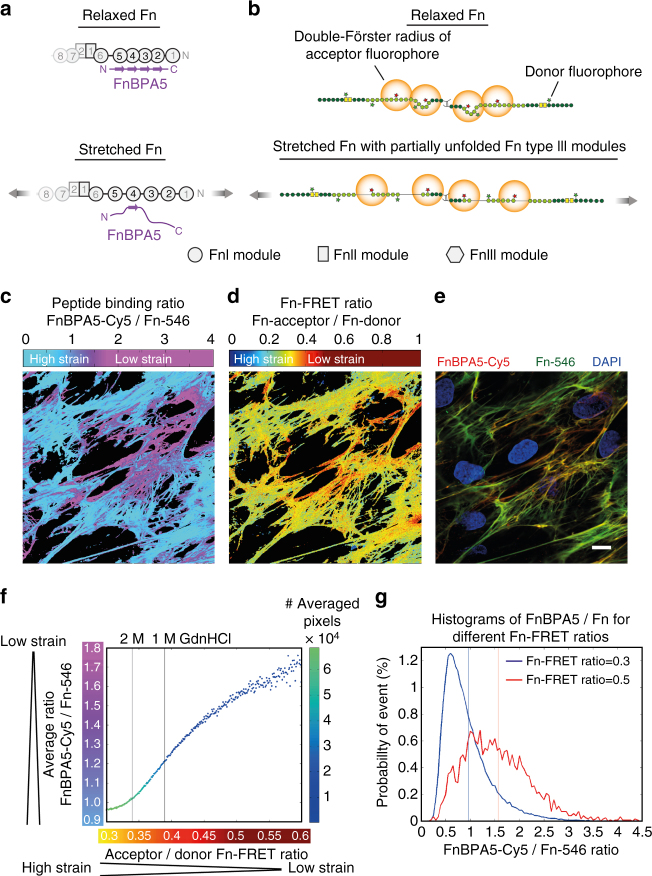
Fig. 3.
Comparison of FnBPA5 binding to a fibroblast-grown native Fn matrix using a Fn-FRET probe. a Schematic of strain-sensitive binding of FnBPA5 to N-terminal FnI domains of Fn. b Schematic of Fn-FRET probe with acceptor fluorophores at specified domains and donor fluorophores at random locations, exhibiting a lower energy transfer in stretched ECM fibers compared to relaxed ones. c FnBPA5-Cy5 was normalized with directly excited Fn-546, showing in the false color ratiometric image high FnBPA5 binding in violet areas. d False color ratiometric image of Fn-Acceptor 546/Fn-Donor 488 (FRET ratio). Red colors represent higher FRET ratios representing more relaxed Fn conformations, whereas blue colors show lower FRET ratios corresponding to regions with more stretched Fn. e Merged fluorescence image of FnBPA5-Cy5 (red), Fn-546 (green), and DAPI (blue) from the same field of view as in c and d. Scale bar, 10 μm. f Quantitative analysis of average FnBPA5 binding vs. Fn-FRET ratios for all images (n > 10) of an experiment shows an increase in FnBPA5 binding for higher FRET ratios. Number of pixels used for averaging is given in the color code. g Histograms of the FnBPA5-Cy5/Fn-546 ratios for two selected Fn-FRET ratios (0.3 and 0.5). Vertical lines represent the arithmetic means of the distributions. Shift of distribution of FnBPA5/Fn for the FRET value of 0.5 (red) indicates a higher overall binding compared to distribution for FRET value of 0.3 (blue). Please note that the FnBPA5-Cy5/Fn-546 ratios are intensity ratios and do not give the ratios of molecules

