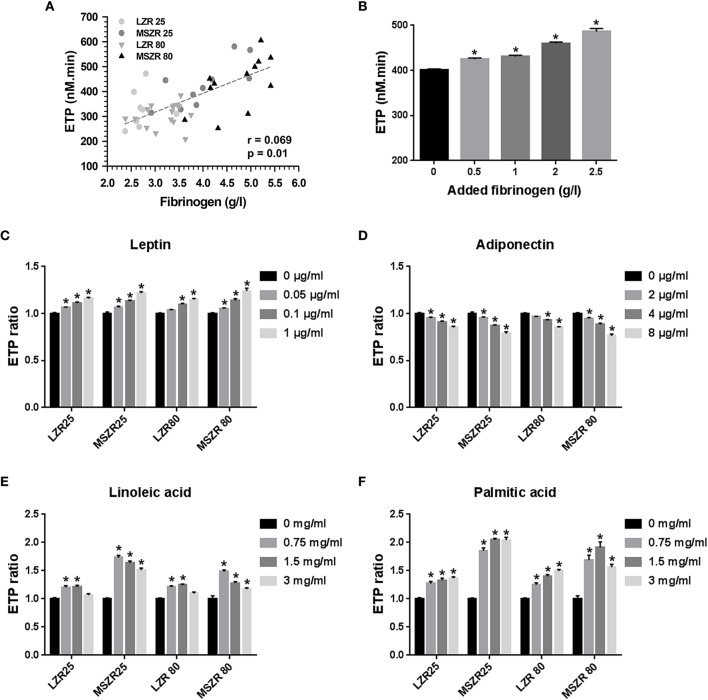
Figure 2.
Effect of fibrinogen, adipokines, and free fatty acids on thrombin generation. (A) Correlation between ETP and plasma fibrinogen concentration of 25 and 80 week-old LZR and MSZR (r = 0.069, p = 0.01). (B) ETP values in 25 week-old LZR platelet free plasma supplemented with 0.5, 1.0, 2.0, or 2.5 g/l fibrinogen. (C–F) ETP values, expressed as ratios of values in presence of adipokines or free fatty acids to those obtained with no addition for each group, in platelet free plasma supplemented with 0.05, 0.1, or 1.0 ng/ml leptin (C), with 2, 4, or 8 μg/ml adiponectin (D), with 0.75, 1.5, or 3 mg/ml of linoleic acid (E) or with 0.75 1.5, or 3 mg/ml of palmitic acid (F). Results are mean ± standard error of the mean (n = 11–16). *p < 0.05 vs. no addition.

