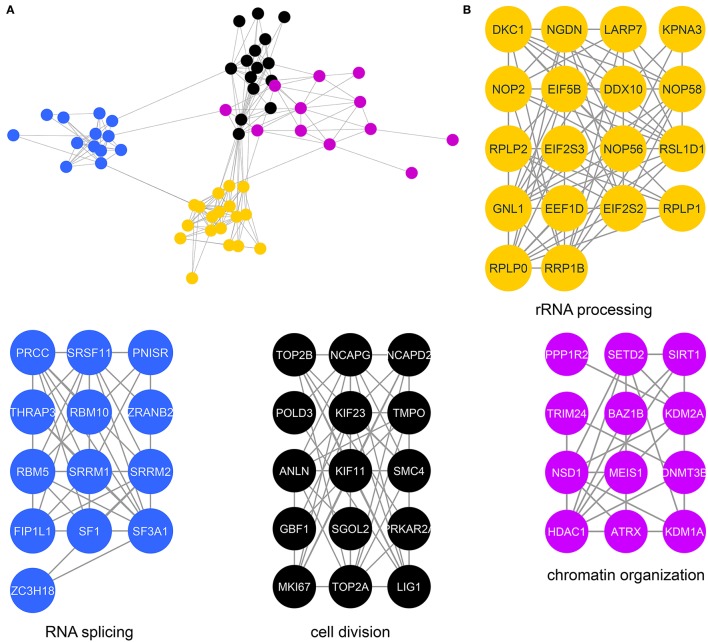
Figure 3.
Protein interaction network of candidate mitotic CK2 substrates. (A) Network depicting statistically significant enriched clusters of interacting proteins from sites identified as potential CK2 substrates using STRING and visualized in Cytoscape. (B) Individual enriched clusters from (A) and their enriched Gene Ontology biological process.

