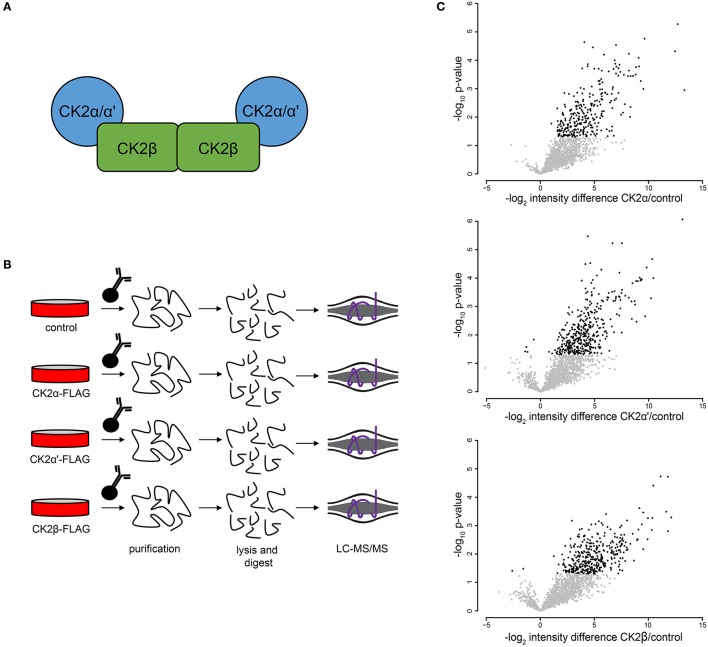
Figure 4.
Mitotic CK2 AP-MS analysis. (A) Scheme depiction of tetrameric CK2 complex found in cells. (B) Scheme for identification of mitotic CK2 interactors. Cells were transfected with different FLAG-tagged CK2 subunits or control and mitotically arrested. Cells were collected, lysed, and FLAG-tagged proteins were purified, TCA precipitated, and analyzed by LC-MS/MS. (C) Volcano plots of the log2 difference in intensity between sample and control against the negative log10 of the p-value of the replicate fold change for each of the three purifications performed.

