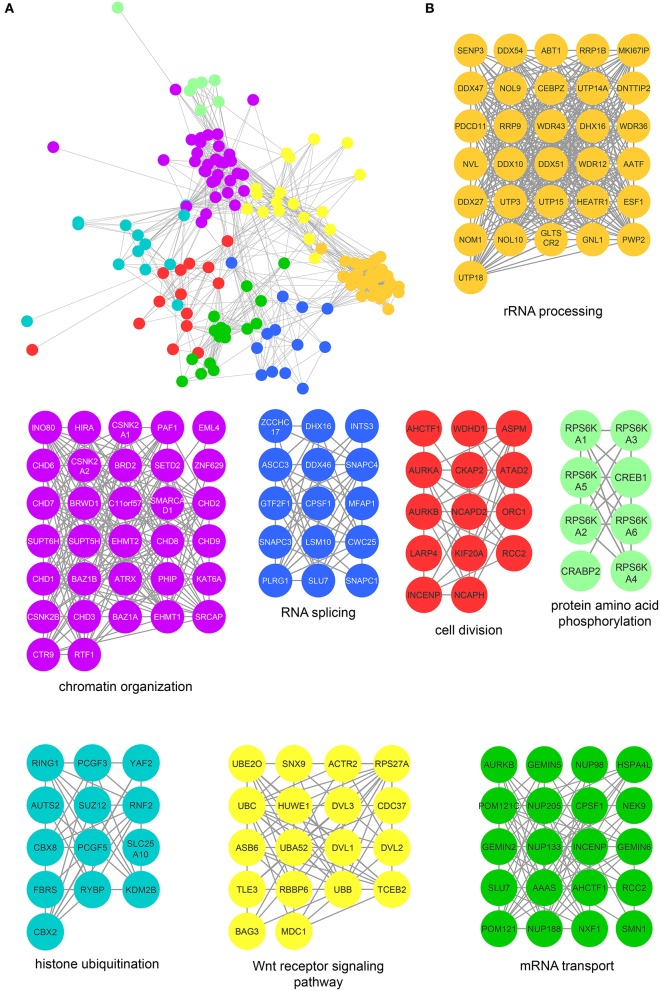
Figure 5.
Protein interaction network of mitotic CK2 interactors. (A) Network depicting statistically significant enriched clusters of interacting proteins from CK2-interacting proteins identified by two or more peptides whose abundance increased 3-fold or more over control. (B) Individual enriched clusters from (A) and their enriched Gene Ontology biological process.

