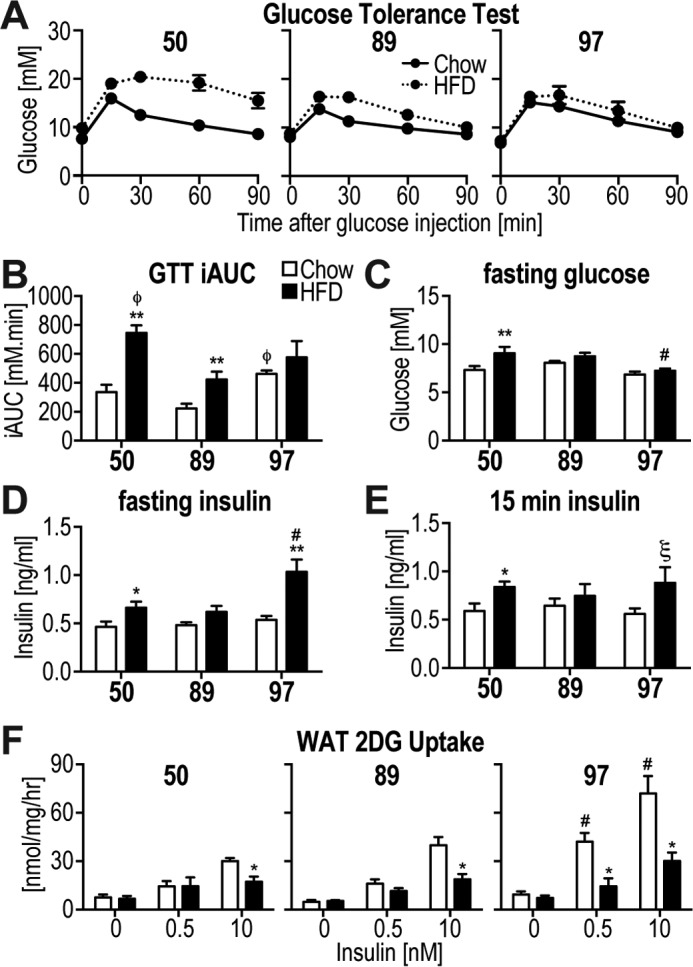
Figure 2.

Variability in metabolic phenotypes in response to HFD. A and B, intraperitoneal GTT at a glucose dose of 2 g/kg lean mass was performed on the mice at week 5 of the diet intervention. A, blood glucose was measured during the GTT. B, iAUC analysis from data in A. C, fasting blood glucose was assessed. D and E, blood insulin was assessed after fasting (D) and at 15 min following glucose injection (E). F, 2-[3H]deoxyglucose uptake was assessed in response to indicated doses of insulin in WAT explants. Data are mean ± S.E., n = 5–10 (A–E), n = 5–6 (F); *, different from corresponding chow group: *, p < 0.05; **, p < 0.01; ***, p < 0.001; ξ, p < 0.05 (one-tailed t test); #, different from all other strains p < 0.05; φ, different from strain #89 p < 0.05.
