Figure 3.

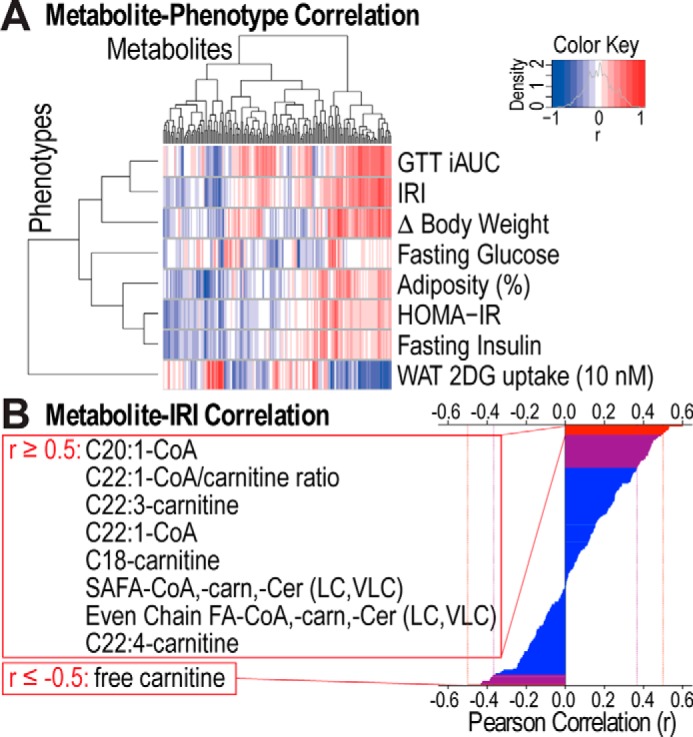
113 metabolites significantly correlate with metabolic phenotypes. A, hierarchical clustering and heat map of Pearson correlation coefficients of correlations between metabolites and metabolic phenotypes are displayed. Blue and red corresponds to negative or positive correlation, respectively. B, Pearson correlation coefficients of correlations between metabolites and IRI are shown. 44 metabolites significantly correlated with IRI (purple and red) and 9 of these had a correlation coefficient ≥0.5 or ≤ −0.5 (red). FA, fatty acyl; SAFA, saturated FA; carn, carnitine; Cer, ceramide; LC, long-chain; VLC, very-long-chain.
