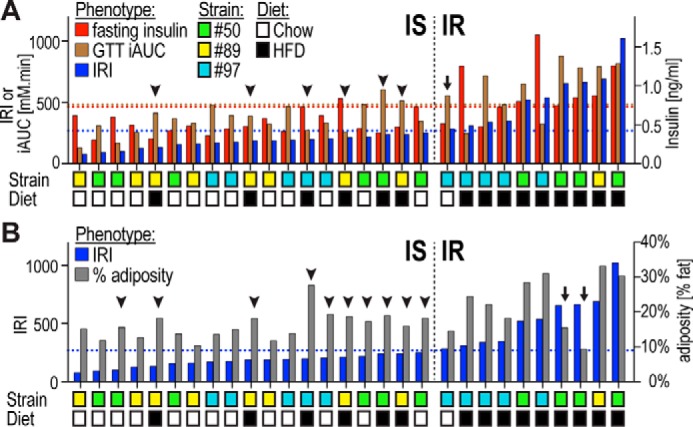
Figure 4.

Metabolic phenotypes in individual mice. A and B, indicated metabolic phenotypes are shown in 29 individual mice ranked for insulin resistance as assessed by the IRI. A, insulin-resistant (IR) chow-fed mice (arrow) and insulin-sensitive (IS) HFD-fed mice (arrowheads) are indicated. B, two HFD-fed IR mice (arrows) displayed lower adiposity than any HFD-fed IS mice or even some chow-fed IS mice (arrowheads). Upper tertile cutoffs of metabolic phenotypes are indicated with dotted lines.
