Figure 6.

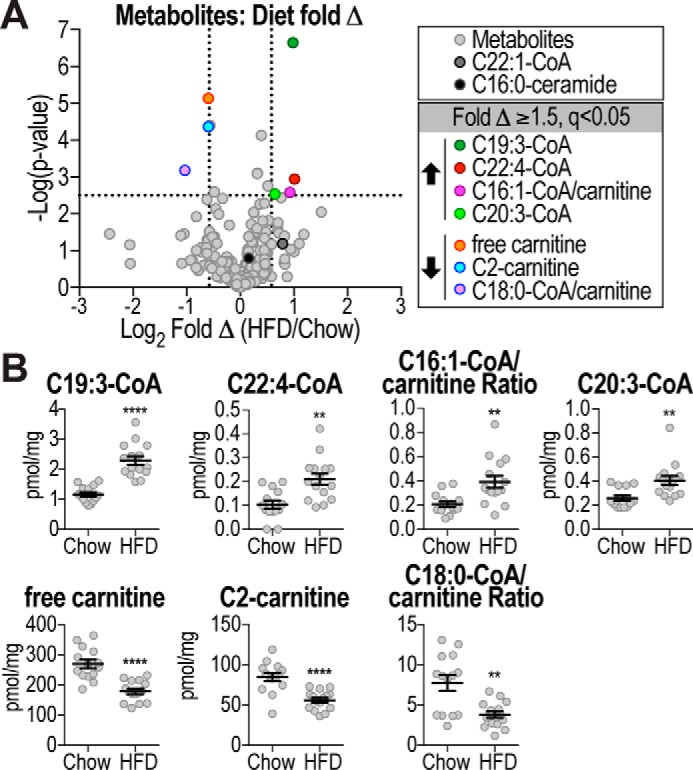
Metabolites changed with diet. A, volcano plot shows metabolite log2 fold change (Δ) of HFD-fed mice compared with chow-fed mice plotted against −log10 p value, indicating significantly changed (q <0.05, above horizontal line) metabolites. Vertical lines indicate ±1.5-fold change (±0.58 log2 fold change). C22:1-CoA and C16:0-ceramide are indicated. B, metabolite levels or ratios of significantly changed metabolites (fold Δ ≥1.5, q<0.05) in chow and HFD-fed mice are shown. Data are mean ± S.E., n = 14–15; **, p < 0.01; ****, p < 0.0001.
