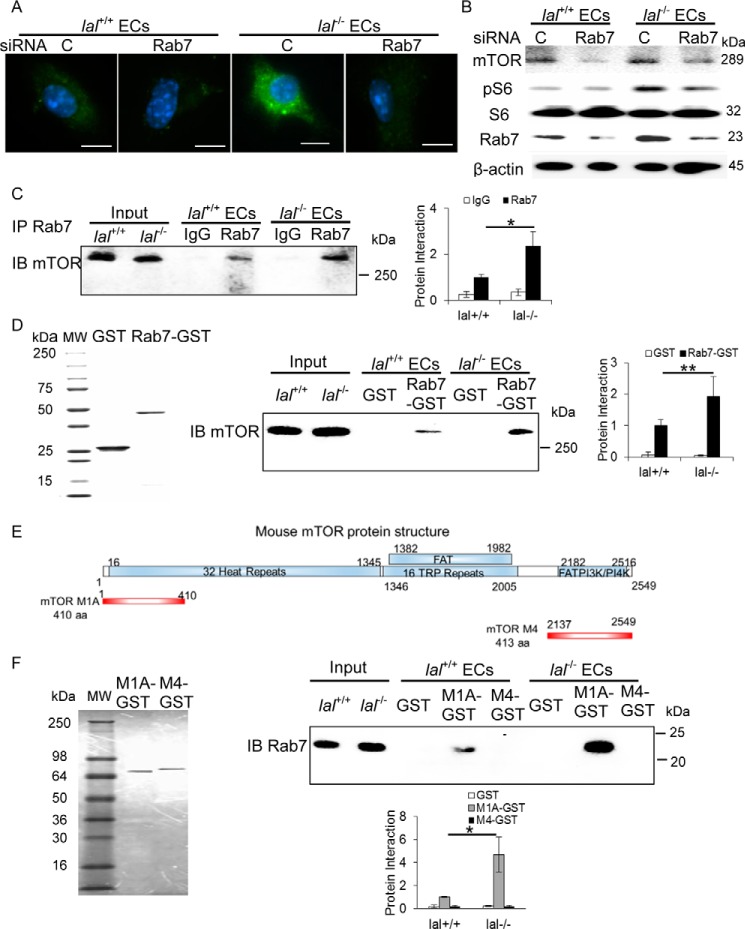
Figure 4.
Rab7 GTPase interacted with mTOR and influenced mTOR downstream signaling. A, immunofluorescence staining of Rab7 GTPase in ECs after Rab7 GTPase siRNA knockdown. Original magnification, ×600. Scale bars = 10 μm. C, control. B, Rab7 GTPase siRNA knockdown reduced mTOR, phosphorylated S6 and Rab7 GTPase protein levels in ECs by Western blot analysis. C, immunoprecipitation (IP) assay of Rab7 GTPase and mTOR interaction. EC lysates were immunoprecipitated by control IgG (IgG) or anti-Rab7 GTPase antibody (Rab7) and detected by anti-mTOR antibody in Western blot analysis. Left panel, a representative immunoprecipitation detected by Western blot analysis. Right panel, statistical analyses of three independent immunoprecipitation assays. IB, immunoblot. D, GST pulldown assay of Rab7 GTPase and mTOR interaction. Left panel, the purity of recombinant GST and Rab7–GST fusion protein was visualized by Coomassie Blue staining on SDS-PAGE. Center panel, lal+/+ and lal−/− EC lysates were incubated with purified recombinant GST or Rab7–GST fusion protein, pulled down with GST beads, and detected by anti-mTOR antibody in Western blot analysis. Right panel, statistical analyses of three independent Rab7-GST pulldown assays. MW, molecular weight. E, schematic of the mTOR domain structure (top) and PCR-generated GST–mTOR M1A and M4 fusion fragments (bottom). F, left panel, expression and purification of two recombinant mTOR fragment GSTs. Top right panel, pulldown of endogenous Rab7 GTPase in lal+/+ or lal−/− ECs by recombinant mTOR M1A–GST and mTOR M4–GST fusion fragments. Bottom right panel, statistical analyses of three independent mTOR fragment GST pulldown assays. One microgram of input was loaded on the gels for the pulldown and immunoprecipitation experiments. *, p < 0.05; **, p < 0.01.

