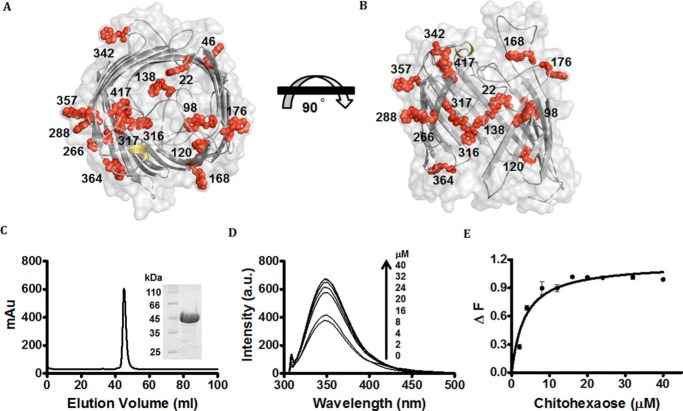
Figure 2.
Protein–ligand binding studied by fluorescence spectroscopy. A and B, surface and cartoon representation of top view of model EcChiP (A) and surface and cartoon representation (B) of EcChiP, showing a top view and a 90° rotation representing a cross-section of the side view. All Trp residues in the EcChiP pore are represented as red stick-and-ball models. β-Barrels, smooth loops, and the surface of EcChiP are shown in gray, and α-helices are shown in yellow. Trp-22, Trp-120, Trp-138, Trp-316, and Trp-317 are positioned inside the pore, whereas Trp-98 (in L2), Trp-176 (in L4), Trp-364 (in L8), and Tyr-417 (in L9) can protrude into the channel from extracellular side. Trp-342 is part of a periplasmic turn. Other tryptophan residues (positions 46, 168, 266, 288, and 357) are located at different positions around the outer surface of the barrel. C, chromatographic profile of EcChiP purification with a HiPrep 16/60 Sephacryl S-200 high-resolution column connected to an ÄKTA Prime plus FPLC system. Bound proteins were eluted with a 20 mm phosphate buffer, pH 7.4, in the presence of 0.05% LDAO. SDS-PAGE analysis of purified EcChiP is shown in an inset (EcChiP samples were heated). D, effects of chitohexaose on the intrinsic fluorescence of EcChiP. Aliquots of chitohexaose were added to 720 ng/ml (final concentration) of EcChiP as shown. E, binding curves for chitohexaose. Binding curves were evaluated with a non-linear regression function available in Prism version 5.0 (GraphPad Software) using a model based on a single binding site. Experiments were performed in triplicate, and the results shown are averages.

