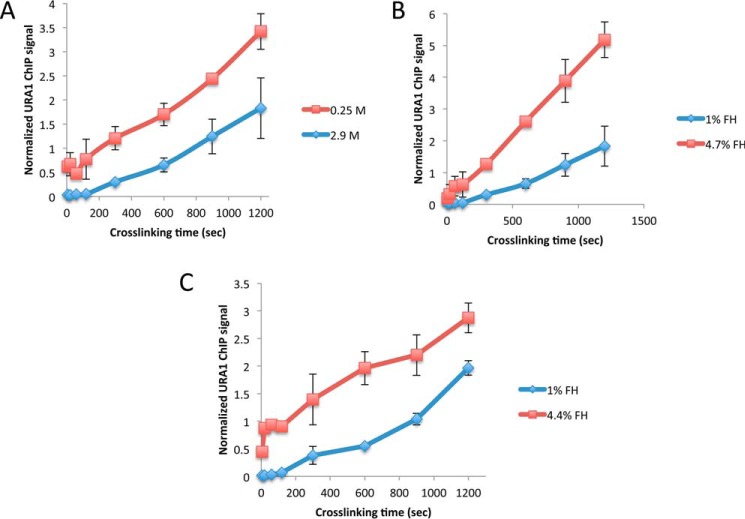
Figure 1.
Effect of different formaldehyde and quench conditions on TBP-myc ChIP signal at the URA1 locus. A, TBP-myc strain was cross-linked for varying amounts of time with 1% (360 mm) formaldehyde followed by quenching with either low (0.25 m, red line) or high (2.9 m, blue line) glycine. ChIP was performed followed by analysis with real-time PCR at the URA1 locus. Normalized ChIP signal is the IP signal minus mock signal divided by an input signal; values were determined from a standard curve. B, similar to A, but TBP-myc–expressing cells were cross-linked for varying amounts of time with 1% (blue line) or 4.7% (red line) formaldehyde and quenched with high (2.9 m) glycine. C, similar to B, but 1% (blue line) or 4.4% (red line), formaldehyde was used for cross-linking and 600 mm Tris, pH 8, for quenching. For each plot, two replicates were collected, and the error bars represent the standard deviation.

