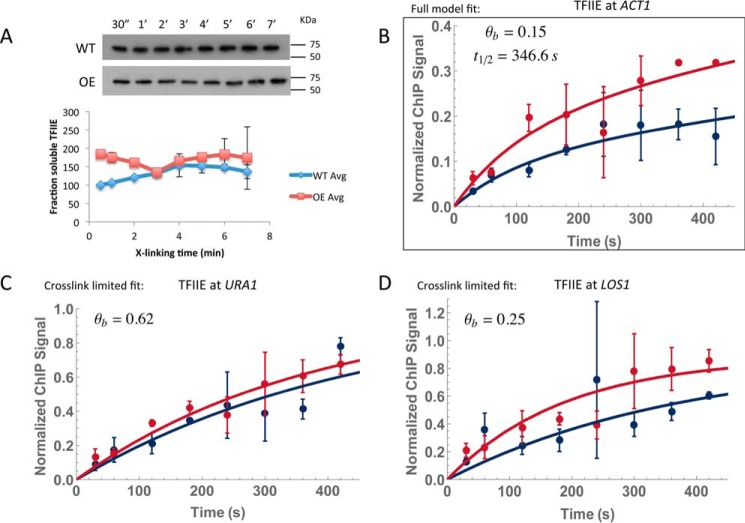
Figure 10.
CLKv2 for TFIIE on a shorter experimental time scale. A, Western blot of Tfa1-TAP chromatin using an anti-TAP antibody. Samples were cross-linked for 30 s to 7 min. Wild-type and overexpression strains were both tested for depletion. Quantification of the signal was plotted below; two replicates were averaged, and the standard deviation is shown as error bars. The wild-type strain was normalized to its 30-s time point; the overexpression strain was normalized to its 30-s time point and multiplied by the overexpression factor (supplemental Table S3). The overexpression factor was determined by running four 5% formaldehyde–cross-linked time points for the wild-type and overexpression strains on the same gel and blotting for TAP tag (data not shown). Bands were quantified with ImageJ and compared with determined overexpression. B, TFIIE at ACT1 resulted in a full model fit; occupancy and residence time are denoted. C and D, TFIIE at both URA1 and LOS1 gave cross-link–limited fits; only the occupancy is shown. Each dataset resulted from two biological replicates, and the average is shown. Error bars represent the standard deviation.

