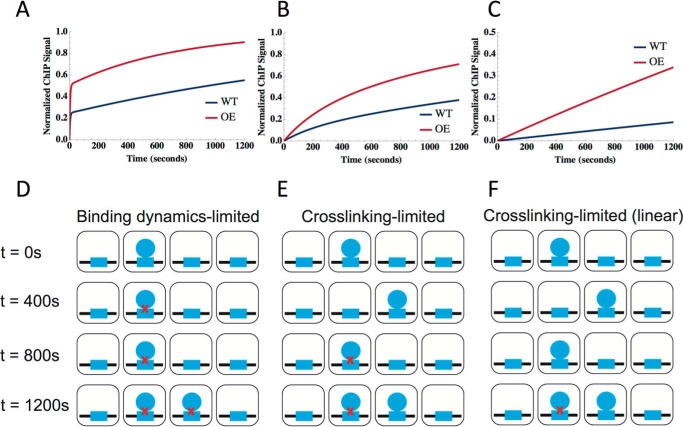
Figure 6.
Overview of CLKv2 possible model fits. A–C, simulations of CLKv2 fits. For each plot, blue represents the wild-type strain, and red is the overexpression strain. From left to right, the fits correspond to: binding dynamics (TF)-limited (A), cross-linking–limited (B), and linear cross-linking–limited behavior (C). D–F, schematic of binding dynamics for each of the three CLKv2 cases with formaldehyde–cross-linking over time: TF-limited (D), XL-limited (E), and linear XL-limited (F). In each square cell, the TF (blue circles) binds to its binding site (blue rectangles); red × symbols represent cross-linking by formaldehyde. Cross-linking time increases as the panels progress from top to bottom.

