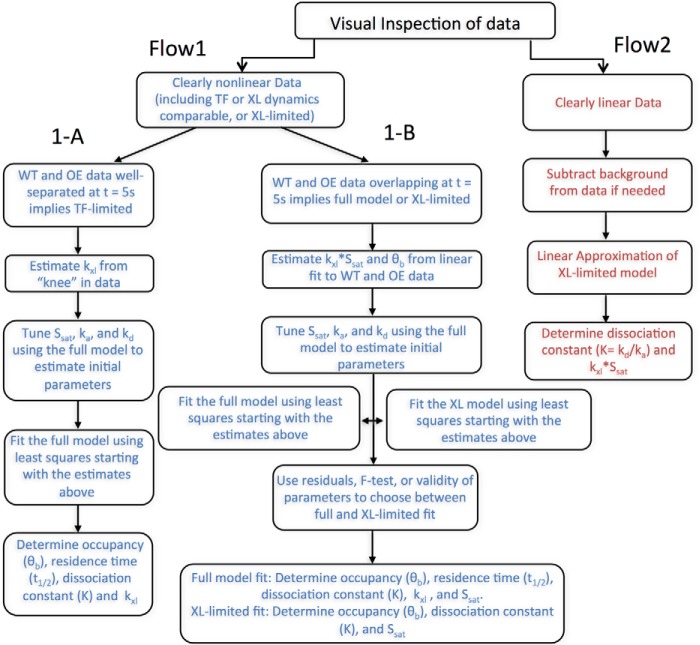
Figure 7.
Flow chart for fitting CLKv2 data. After visual inspection of the data, the fitting procedure in either Flow1 arm (blue) or Flow2 arm (red) was followed for a given locus. Fitting procedure for non-linear data were further broken down into arm 1-A or 1-B. Arm 1-A represents the TF full-model fit, whereas 1-B could be cross-linking–limited or full model fit. Flow2 is the linear cross-linking–limited fit.

