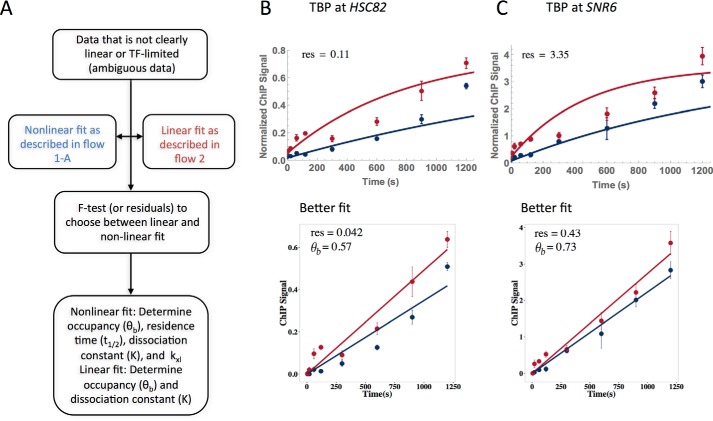
Figure 9.
Resolution of ambiguous TBP fits. A, flow chart to determine best fit for ambiguous data. Data were fit with both linear and full models, and F tests or SSR was then used to differentiate the best fit. B and C, TBP fits at HSC82 (B) and SNR6 (C) were fit with both full (top) and linear (bottom) models. SSR derived from the fits was used to find that both datasets were best represented with the linear fit; SSR (labeled res) is shown on all four plots and occupancy (θb) for the linear fit. Each dataset resulted from two biological replicates, and the average is shown. Error bars represent the standard deviation.

