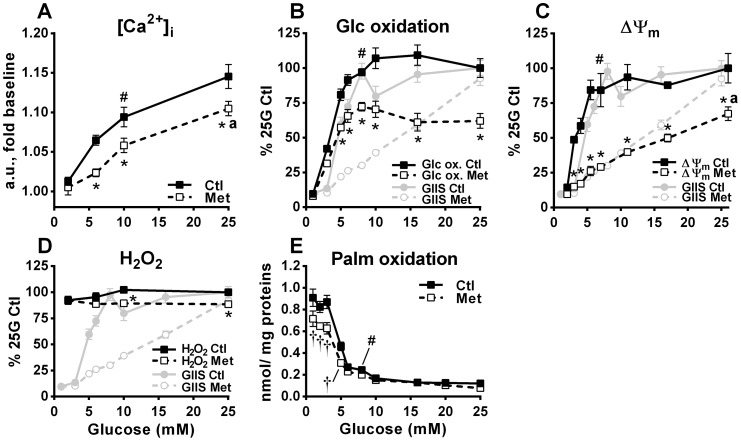
Figure 2.
Effect of various glucose concentrations on intracellular Ca2+, glucose and fatty acid oxidation, mitochondrial membrane potential, and H2O2 production in the absence and presence of metformin. INS1 (832/13) cells were treated with 5 mm metformin (Met) or vehicle (Ctl) at the indicated glucose concentrations, as described under “Experimental procedures.” GIIS data from Fig. 1A has been added to some graphs for comparison. A, intracellular free calcium ([Ca2+]i) expressed as fold change in fluorescence 8 min after glucose addition when maximal glucose effect was reached; n = 12 from 2 separate experiments. a.u., arbitrary units. B, d-[U-14C]glucose oxidation to CO2 expressed as percentages of 25 mm glucose (25G) control condition calculated from the nmol glucose (Glc) oxidized after 45-min incubation/mg proteins; n = 6 from 3 separate experiments. Raw glucose oxidation values, as nmol/mg proteins/45 min, are as follows: for vehicle-treated cells, 3.0 ± 0.2 at 1 mm glucose and 31.8 ± 2.2 at 25 mm glucose; and for metformin-treated cells, 2.5 ± 0.1 at 1 mm glucose and 19.7 ± 1.7 at 25 mm glucose. C, mitochondrial membrane potential (ΔΨm) expressed as percentages of the 25 mm glucose control condition, calculated from absolute difference in fluorescence between the 1 mm glucose condition and the indicated glucose condition 30 min after glucose addition; n = 6 from 2 determinations performed separately for each glucose concentration (16 separate experiments in total). D, H2O2 cellular content expressed as percentages of 25 mm glucose control condition calculated from fold change in fluorescence versus the 2 mm glucose control condition after 20 min incubation; n = 8 from 2 separate experiments. E, [1-14C]palmitic acid oxidation to CO2 expressed as nmol of palmitic acid (Palm) oxidized after 45 min incubation/mg proteins; n = 4 from 2 separate experiments. The results are expressed as means ± S.E. Two-way ANOVA with Sidak's multiple comparisons test was used. #, p < 0.05 for glucose effect from 1/2 mm glucose to 7–10 mm glucose in the control condition; * or †, p < 0.05 for metformin effect inhibiting (*) or enhancing (†) glucose-induced changes versus control at a given glucose concentration; a, p < 0.05 for glucose effect from 7–10 to 25 mm glucose in metformin condition.

