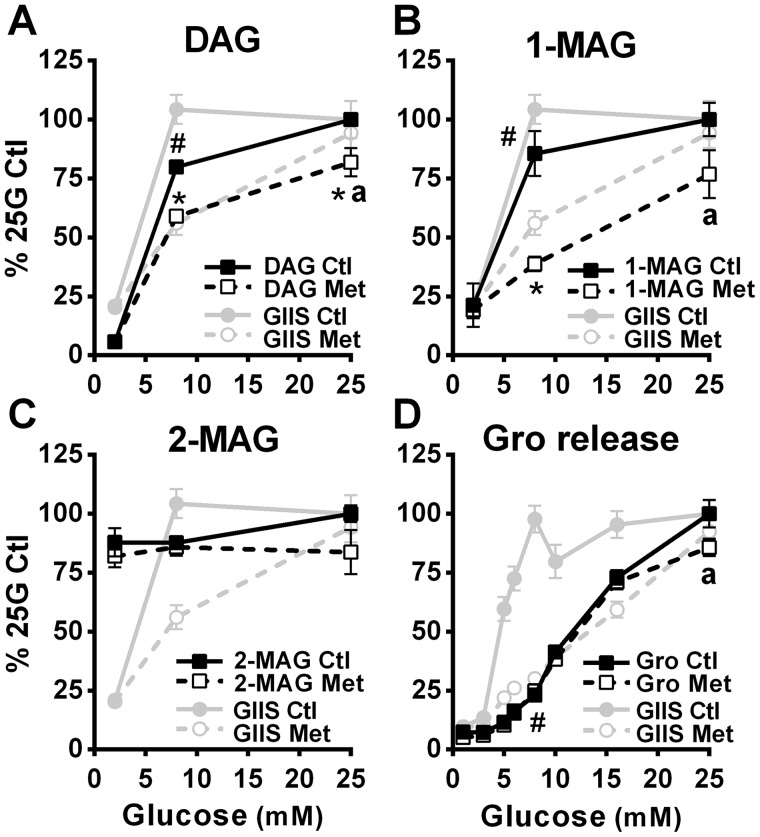
Figure 4.
Effect of glucose on the incorporation of palmitate into DAG and MAG, and on glycerol release in the absence and presence of metformin. Lipid metabolism was measured in INS1 (832/13) cells treated with 5 mm metformin (Met) or vehicle (Ctl). A–C, [1-14C] palmitic acid incorporation into DAG (mixture of 1,2-DAG and 2,3-DAG; A), 1-MAG (B), and 2-MAG (C). All the data (metformin and control conditions) are expressed as percentages of the 25 mm glucose (25G) control condition calculated from the nmol of palmitic acid esterified after 1 h incubation/mg proteins; n = 4 from 2 separate experiments. Average palmitic acid incorporation is as follows, in nmol of palmitic acid incorporated/mg protein/h: for DAG, control condition, 0.27 at 2 mm glucose and 6.37 at 25 mm glucose; for DAG, metformin condition, 0.32 at 2 mm glucose and 4.90 at 25 mm glucose; for 1-MAG, control condition, 0.046 at 2 mm glucose and 0.225 at 25 mm glucose; for 1-MAG, metformin condition, 0.042 at 2 mm glucose and 0.137 at 25 mm glucose; for 2-MAG, control condition, 0.27 at 2 mm glucose and 0.29 at 25 mm glucose; and for 2-MAG, metformin condition, 0.24 at 2 mm glucose and 0.22 at 25 mm glucose. D, glycerol (Gro) release expressed as percentages of the 25 mm glucose control condition calculated from the nmol glycerol released after 45 min incubation/mg protein; n = 9 from 3 separate experiments. Raw glycerol values, as nmol/mg proteins/45 min, are as follows: for vehicle-treated cells, 1.9 ± 0.3 at 1 mm glucose and 25.7 ± 1.5 at 25 mm glucose; and for metformin-treated cells, 1.5 ± 0.3 at 1 mm glucose and 22.0 ± 1.0 at 25 mm glucose. GIIS data from Figs. 1A (D) and 5A (A–C) have been added to the graphs for comparison. The results are expressed as means ± S.E. Two-way ANOVA with Sidak's multiple comparisons test was used. #, p < 0.05 for glucose effect from 1/2 mm glucose to 8 mm glucose in the control condition; *, p < 0.05 for metformin effect versus control at a given glucose concentration; a, p < 0.05 for glucose effect from 8 to 25 mm glucose in the metformin condition.

