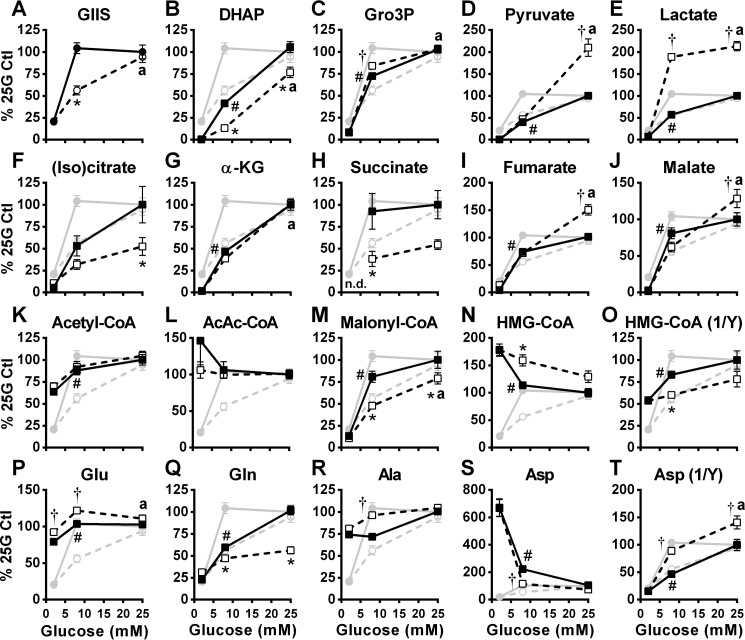
Figure 5.
Effect of glucose on the cellular content of glycolysis and citric acid cycle intermediates, short-chain acyl-CoAs, and amino acids in the absence and presence of metformin. GIIS (circles) and metabolites (squares) were measured in INS1 (832/13) cells treated with 5 mm metformin (white symbols) or vehicle (black symbols). Metabolites were extracted from cells at the end of an incubation period of 45 min. A, insulin released in the medium expressed as percentages of 25 mm glucose (25G) control condition calculated from the ng insulin/mg protein. B–T, intracellular metabolite contents expressed as percentages of 25 mm glucose control condition calculated from LC-MS peak area values normalized by protein content. Citrate and isocitrate are not differentiated by the method used. The results are expressed as means ± S.E.; n = 12 from 4 separate experiments. Two-way ANOVA with Sidak's multiple comparisons test was used. #, p < 0.05 for glucose effect from 2 to 8 mm glucose in the control condition; * or †, p < 0.05 for metformin effect inhibiting (*) or enhancing (†) glucose-induced changes versus control at a given glucose concentration; a, p < 0.05 for glucose effect from 8 to 25 mm glucose in the metformin condition. (Iso)citrate, both citrate and isocitrate; α-KG, α-ketoglutarate; AcAc-CoA, acetoacetyl-CoA.

