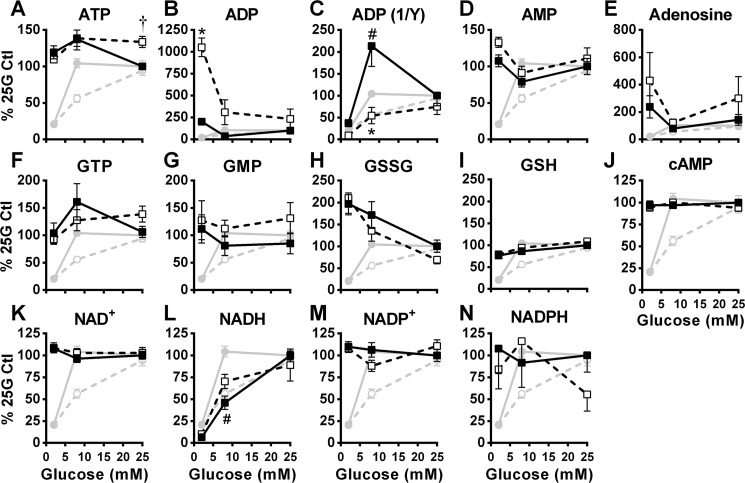
Figure 6.
Effect of glucose on the cellular content of purine nucleotides, nicotinamide nucleotides, and glutathione in the absence and presence of metformin. The data were obtained from the same experiments shown in Fig. 5, except that additional metabolites are shown. GIIS (circles) and metabolites (squares) were measured in INS1 (832/13) cells treated with 5 mm metformin (white symbols) or vehicle (black symbols). A–N, intracellular metabolite contents expressed as percentages of the 25 mm glucose (25G) control condition. GIIS from Fig. 5A has been added to the graphs for comparison with metabolite levels. The results are expressed as means ± S.E.; n = 12. Two-way ANOVA with Sidak's multiple comparisons test was used. #, p < 0.05 for glucose effect from 2 to 8 mm glucose in the control condition; * or †, p < 0.05 for metformin effect inhibiting (*) or enhancing (†) glucose-induced changes versus control at a given glucose concentration.

