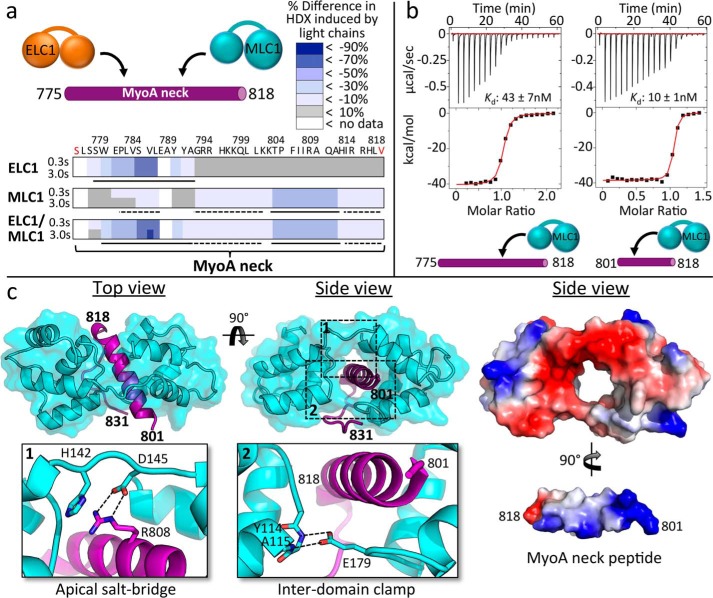
Figure 2.
MLC1-binding region on MyoA neck analyzed by HDX, ITC, and X-ray crystallography reveals several key interactions crucial to complex formation. a, HDX heat maps showing difference in percentage of backbone amide deuterium incorporation of MyoA neck induced by binding of light chains at two time points of exchange. Putative directly ordered regions are marked with solid lines, and putative indirectly ordered regions are marked with dashed lines. Sequence of the MyoA peptide is shown. Red coloring of terminal residues indicates N-terminal acetylation or C-terminal amidation. Refer to supplemental Table S1 for the full HDX-MS data set relating to this figure. b, representative ITC binding isotherms following the titration of MLC1 into a solution of MyoA (775–818) or MyoA (801–818). c, left panel, 1.85 Å resolution crystal structure of MLC1 in complex with MyoA (801–831) with close-ups of the apical salt bridge (inset 1) formed between MLC1 Asp145 and MyoA Arg808 and MLC1 “clamp” (inset 2) formed via two hydrogen bonds between Glu179 and backbone amides of Tyr114 and Ala115. Right panel, electrostatic surface maps of MLC1 and the MyoA neck peptide. In this view, the MyoA neck peptide has been extracted from the surrounding MLC1 and rotated to reveal the basic surface along its helical longitudinal axis.

