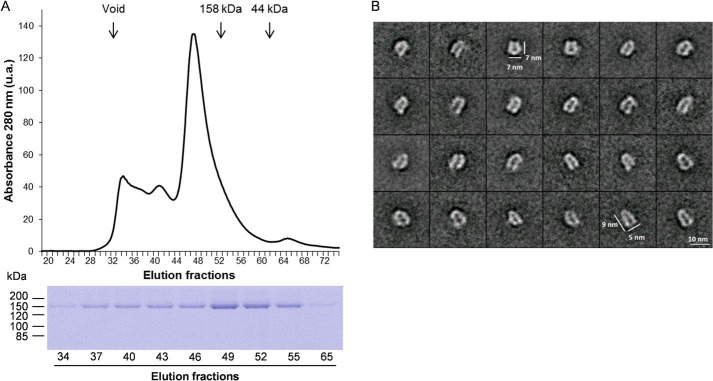
Figure 3.
Quaternary structure analysis of NtPDR1. A, purified NpPDR1 was analyzed by size-exclusion chromatography on a Superdex 200 column. Protein elution was followed by monitoring the absorbance at 280 nm. The elution peaks corresponding to size markers are indicated by vertical arrows. Below is shown the SDS-PAGE analysis of the indicated fractions. B, single-particle analysis of negatively stained NtPDR1. A gallery of representative 2D class averages is shown. u.a., arbitrary units of absorbance.

