Abstract
Cytotoxin-producing Klebsiella oxytoca is the causative agent of antibiotic-associated hemorrhagic colitis (AAHC). Recently, the cytotoxin associated with AAHC was identified as tilivalline, a known pentacyclic pyrrolobenzodiazepine (PBD) metabolite produced by K. oxytoca. Although this assertion of tilivalline's role in AAHC is supported by evidence from animal experiments, some key aspects of this finding appear to be incompatible with toxicity mechanisms of known PBD toxins. We therefore hypothesized that K. oxytoca may produce some other uncharacterized cytotoxins. To address this question, we investigated whether tilivalline alone is indeed necessary and sufficient to induce cytotoxicity or whether K. oxytoca also produces other cytotoxins. LC-MS- and NMR-based metabolomic analyses revealed the presence of an abundant tricyclic PBD, provisionally designated kleboxymycin, in the supernatant of toxigenic K. oxytoca strains. Moreover, by generating multiple mutants with gene deletions affecting tilivalline biosynthesis, we show that a tryptophanase-deficient, tilivalline-negative K. oxytoca mutant induced cytotoxicity in vitro similar to tilivalline-positive K. oxytoca strains. Furthermore, synthetic kleboxymycin exhibited greater than 9-fold higher cytotoxicity than tilivalline in TC50 cell culture assays. We also found that the biosynthetic pathways for kleboxymycin and tilivalline appear to overlap, as tilivalline is an indole derivative of kleboxymycin. In summary, our results indicate that tilivalline is not essential for inducing cytotoxicity observed in K. oxytoca-associated AAHC and that kleboxymycin is a tilivalline-related bacterial metabolite with even higher cytotoxicity.
Keywords: antibiotics, apoptosis, bacterial toxin, colitis, infectious disease
Introduction
Klebsiella is a genus of non-motile Gram-negative rod-shaped bacteria commonly encountered in the environment. Similar to other members of the family Enterobacteriaceae, Klebsiella spp. are associated with a wide range of diseases, including nosocomial pneumonia, urinary tract infections, biliary tract infections, surgical wound infections, and deep abscesses (1). In addition, the prevalence of high-level antibiotic resistance is increasing among clinical isolates of Klebsiella spp., with production of extended-spectrum β-lactamases and carbapenemases posing significant challenges to treatment and infection control (2, 3).
Among the diseases associated with Klebsiella spp., antibiotic-associated hemorrhagic colitis (AAHC)2 is a clinical entity that has gained attention in recent years. The disease is caused by the overgrowth of cytotoxin-producing Klebsiella oxytoca secondary to use of antibiotics such as penicillin or amoxicillin (4, 5). The typical colonoscopic finding of AAHC is segmental involvement of the ascending colon characterized by the presence of diffuse mucosal edema and hemorrhagic erosions. This presentation is distinct from the more common form of antibiotic-associated diarrhea caused by toxin-producing Clostridium difficile, which presents with watery diarrhea in mild to moderate disease, but may resemble more severe C. difficile infection. Besides causing human disease, cytotoxin-producing K. oxytoca is also suspected as the causative agent in an outbreak of hemorrhagic colitis on a rabbit farm (6).
Current knowledge on cytotoxin-producing K. oxytoca and associated disease is severely limited by the lack of an accessible diagnostic test. Although a differential culture medium had been developed for isolation of K. oxytoca from stool (7), cytotoxin detection remains a difficult task in the clinical setting. The gold standard for detecting cytotoxin production is the HEp-2 cell culture assay (5, 8), but it has a long turnaround time and is impractical for most clinical laboratories. Furthermore, the cytopathic effects indicative of cytotoxin production are non-specific, and confirmation by neutralization with specific antibodies or antitoxins is currently unavailable. Hence, several reports of K. oxytoca-associated hemorrhagic colitis were not corroborated by cytotoxicity assays on the isolates (9–14), which prevented an accurate assessment of disease prevalence.
Arguably, the fundamental barrier to further studies on the K. oxytoca cytotoxin, including the development of a reliable diagnostic assay, was uncertainty over its real identity. Early studies have suggested that the cytotoxin is a small molecule with a novel chemical structure and a molecular mass of ∼217 Da (15, 16). However, this is in conflict with recent results suggesting that the cytotoxin is actually tilivalline, a pentacyclic pyrrolobenzodiazepine (PBD) with a mass of ∼333 Da (17, 18). The association of tilivalline with cytotoxicity and disease was supported by multiple lines of evidence, including mutagenesis experiments and animal studies, imparting significantly more credibility to the results.
In this study, we performed an independent investigation on the identity of the cytotoxin. Culture supernatants from K. oxytoca strains grown under different culture conditions were examined, and metabolites associated with cytotoxicity were isolated and characterized. Surprisingly, our results revealed that cytotoxicity is associated with a mixture of related molecular species essentially comprising a tricyclic PBD, provisionally designated kleboxymycin, and its derivatives, of which tilivalline is the main species. In vitro assays showed that both kleboxymycin and tilivalline are correlated with cytotoxicity, but the former has higher cytotoxicity by an order of magnitude. The present results strongly suggest that tilivalline is not the sole or even the main cytotoxin produced by AAHC-associated K. oxytoca strains.
Results
Cytotoxin production is influenced by culture conditions
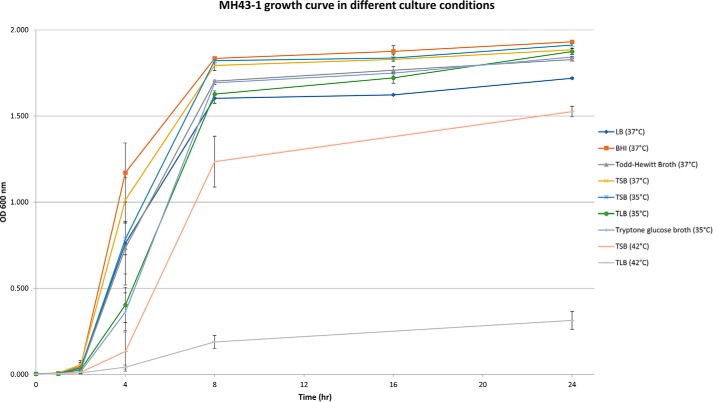
In the course of our experiments to establish the cytotoxin production by K. oxytoca strains, we noticed inconsistency in cytotoxin production under similar conditions by the same strain. Among various modifications of culture conditions, it was found that culturing temperature exceeding 37 °C significantly reduced cytotoxicity of culture supernatants. Bacterial growth rate, as enumerated by A600 nm measurement (Fig. 1) and by colonies counting from subculturing on non-selective agar media, was not adversely affected at culture temperatures between 35 and 37 °C. We have tested with tryptic soy broth (TSB) and then tested with MacConkey broth and found that MacConkey broth could give high cytotoxicity of K. oxytoca strain MH43-1 (64× dilution of broth at which cytopathic effects were still observed). Therefore, we tested which component inside MacConkey broth was the key component that increases the cytotoxicity of MH43-1. Bile salt added to TSB could not increase the cytotoxicity effect. In contrast, glucose and especially lactose added to TSB could increase the cytotoxicity of MH43-1 (supplemental Table S1). MH43-1 cultured in minimal medium only had low cytotoxicity (8× dilution of broth at which cytopathic effects were observed). Higher cytotoxicity was observed with a higher glucose or lactose concentration of up to 10 g/liter (Table 1). Based on these results, we designed a simple tryptone lactose broth medium (see “Experimental procedures”) that consistently induced high levels of cytotoxicity in culture supernatant, which facilitated downstream metabolite identification.
Figure 1.
MH43-1 growth curves in different culture conditions.
Table 1.
Cytotoxicity of K. oxytoca strain MH43-1 culture supernatants from different culture conditions as measured in a cell culture cytotoxicity assay
All cultures were incubated in a shaker at 250 rpm under aerobic conditions for 24 h.
| Culture media | Temperature | Highest dilution with observable cytopathic effects |
|---|---|---|
| LB broth (Sigma) | 37 °C | 2–4× |
| Brain-heart infusion (Sigma) | 37 °C | 4× |
| Todd-Hewitt broth | 37 °C | 4× |
| Tryptic soy broth (TSB) | 37 °C | 4× |
| TSB | 35 °C | 16× |
| TSB | 42 °C | No cytotoxicity |
| Tryptone lactose broth (TLB) | 35 °C | 64× |
| TLB | 42 °C | No cytotoxicity |
| Tryptone glucose broth | 35 °C | 32–64× |
LC-MS/MS analysis on culture supernatant
To profile the metabolite content found in the culture supernatant, triplicate samples were prepared for the toxigenic MH43-1 and non-toxigenic 293206 strains of K. oxytoca cultured in tryptone broth, with and without lactose. Extensive profiling of the culture media was performed using LC-MS, and 3646 unique chemical species were identified with specific mass to charge ratios (m/z) and retention times (RT). These two pieces of acquired information were used as the unique identifier pair for each species present in the samples. The peak areas were determined for each uniquely identified chemical species to quantify their amounts found within each of the 12 samples. A toxicity value for each of the culture media was also performed by incubating HEp-2 cells with samples of the media, and the toxicity was quantified using the MTT cell viability assay.
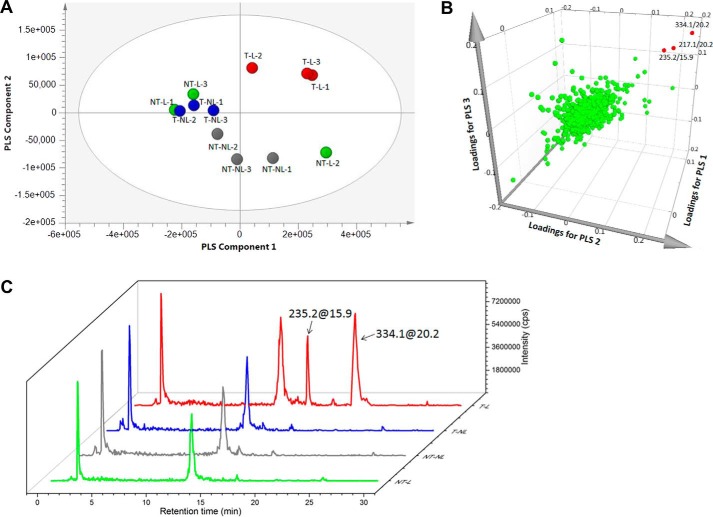
Multivariate analysis was performed on the data matrix as a mean of correlating the metabolite profiles of the culture supernatant with their cytotoxic activities, for the objective of identifying the potential bioactive constituents. The data set was not transformed but was treated with pareto scaling prior to analysis (19). Chemical fingerprint data along with their respective toxicity profiles were subjected to principal component analysis (PCA) to inspect data variation and identify potential outliers. The data were then subjected to partial least squares (PLS) analysis, a supervised extension of PCA, to elucidate the covariance between quantified metabolites as defined by their m/z and RT values (X variables) and toxicity of the media (Y variables) (20). The resulting score plot reveals that the culture media metabolite profiles could be discriminated on the basis of the strains and culture conditions used (Fig. 2A). With the exception of one replicate profile from the non-toxigenic strain cultured in lactose-containing media, all other profiles from the same sample types clustered into discernible groups. Interestingly, the metabolite profiles of the toxigenic MH43-1 grown in the presence of lactose were discriminated from the other three sample types and located in a separate region in the score plot. The performance of model was assessed by examining the R2 (fitness of the model) and Q2 (model predictability) values with all values close to 1 resembling a good model (8). In this study, the model possessed values of R2 = 0.92 and Q2 = 0.8 when three principal components were incorporated in the regression model.
Figure 2.
Multivariate analysis of K. oxytoca culture supernatant metabolite-toxicity profiles identifying potential bioactive compounds. A, PLS score plot of culture supernatant metabolite-toxicity profiles from four culture conditions. The profiles from each condition were prepared in triplicate and are color-coded. NT-L, non-toxigenic strain in lactose-containing media, green; NT-NL, non-toxigenic strain in lactose-free media, gray; T-NL, toxigenic strain in lactose-free media, blue; T-L, toxigenic strain in lactose-containing media, red. B, three-dimensional loadings plot for the metabolite-toxicity profile model generated using PLS. Each green dot represents a unique chemical species identified by its m/z and retention time. Those contributing significantly to all three principal components are labeled and highlighted in red. C, representative extracted-ion chromatogram of different media conditions showing the presence or absence of the metabolites m/z 235.2 at RT 15.9 min and m/z 334.1 at RT 20.2 min. The color coding and labeling of the chromatograms are identical to those used in A. cps, counts/s.
To identify the molecules that provided the greatest contributions to the three principal components used in the model, a three-dimensional loading plot was generated (Fig. 2B). In this plot, most metabolites clustered in the center indicating that their contributions were minimal. However, three candidate molecules were identified as significant contributors to all three principal components. There were two metabolites possessing m/z of 217.1 and 334.1 at the same retention time of 20.2 min and a third metabolite with an m/z of 235.2 at the retention time of 15.9 min. The extracted-ion chromatogram profiles of the culture supernatants were consistent with these findings and showed that these metabolites were found only in the culture supernatant of toxigenic MH43-1 strain in lactose-containing media (Fig. 2C).
To isolate these metabolites, culture supernatant of MH43-1 in lactose-containing medium was subjected to solid-phase extraction chromatography and eluted as three fractions as described under “Experimental procedures.” The LC-MS profiles of each fraction were characterized. The metabolite identified with m/z 235.2 at RT 15.9 min was eventually isolated to fraction peak 1 (P1) after a subsequent reversed-phase chromatography step (supplemental Fig. S1, A and B). This compound was judged to be ∼90% pure based on GC-MS and total ion-current chromatogram profile of the fraction (supplemental Fig. S2). The metabolite identified with m/z 334.1 at RT 20.2 min was found in fraction 3 (supplemental Fig. S1, C and D) and was also determined to be ∼90% pure (supplemental Fig. S3). This fraction was renamed peak 2 (P2) for subsequent experiments. To assess the toxicity of the remaining metabolite population, all other fractions generated from this purification scheme were pooled together and referred to as fraction O.
The metabolite–toxicity relationship was assessed by cell culture toxicity assay of the isolated fractions. In addition to testing individual fractions, P1 and P2 were combined to look for any synergistic effects, and all isolated fractions were combined (P1 + P2 + O) to assess any loss in toxicity from the separation procedure. P1 was found to produce observable cytotoxicity at up to 128× dilution, whereas P2 exhibited lower toxicity of up to 32×. No significant synergistic effects were observed when combining P1 and P2. The recombined fractions demonstrated 2× reduced cytotoxicity with respect to crude supernatant suggesting only minimal loss during separation. These results suggest that the main contributor to toxicity is the metabolite present in P1 rather than P2.
Structure elucidation of kleboxymycin (P1) and its derivatives
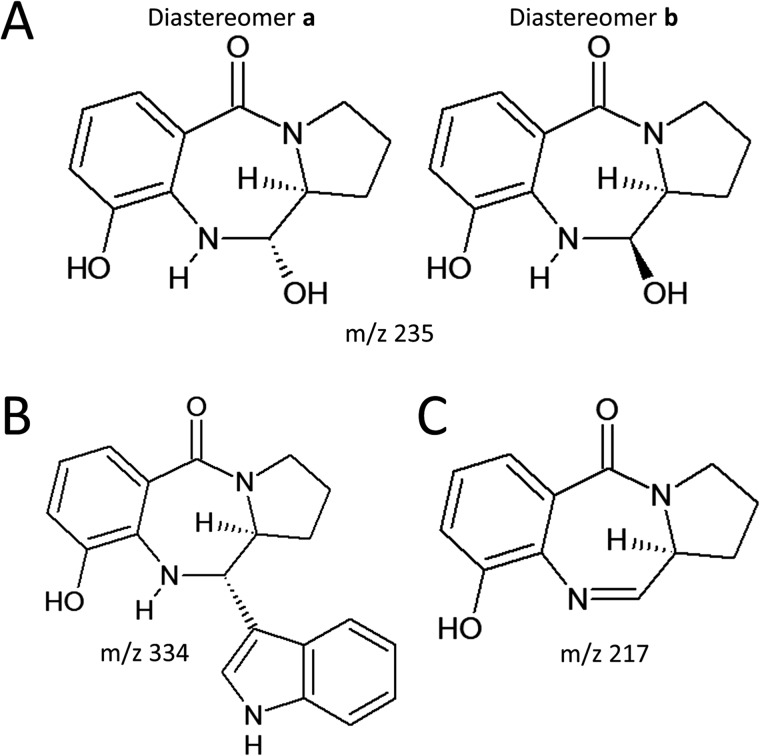
The elemental compositions of the metabolites were determined by mass spectrometry, combined with product ion spectra, GC-MS, and NMR spectroscopy results. Proposed structures of compounds P1 and P2 with m/z 235 and m/z 334, respectively, are shown in Fig. 3. Both molecules consist of a pyrrolobenzodiazepine nucleus and differ in their substituents at the C6 position (21). Compound P1 has a hydroxyl group at this position, whereas compound P2 has an indole substituent and is known as tilivalline (17). Tilivalline was among the known metabolites of K. oxytoca (22) with cytotoxicity toward mammalian cells. We provisionally designated the main contributor to toxicity, compound P1, as kleboxymycin.
Figure 3.
A and B, proposed structures of compound P1 (kleboxymycin) m/z 235 at RT 15.9 min (A) and compound P2 (tilivalline) m/z 334 at RT 20.2 min (B). C, structure of dehydrated form of kleboxymycin at m/z 217.
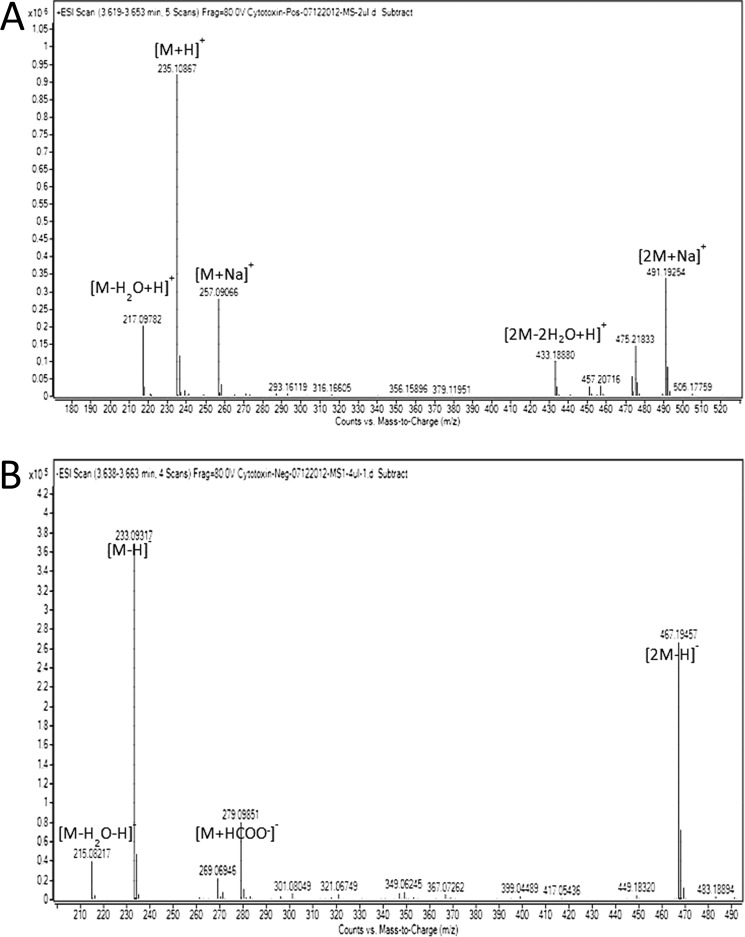
Kleboxymycin showed a protonated molecular ion at m/z 235, sodium adduct of molecular ion at m/z 257, and dimer of sodium adduct of molecular ion at m/z 491, neutral loss of water molecule from protonated molecular ion at m/z 217, as well as dimer of protonated ion from loss of two water molecules at m/z 433 in positive full-scan MS mode (Fig. 4A); deprotonated molecular ion at m/z 233, formate adduct of molecular ion at m/z 279 from the formic acid in the mobile phase, dimer of deprotonated molecular ion at m/z 467, as well as neutral loss of water molecule from deprotonated molecular ion at m/z 215 was observed in negative full-scan MS mode (Fig. 4B). Both positive and negative full scan MS results showed that the molecular formula was C12H14N2O3 for kleboxymycin with the mass accuracy less than 5 ppm.
Figure 4.
MS spectrum for isolated K. oxytoca cytotoxin kleboxymycin in positive ionization mode (A) and negative ionization mode (B).
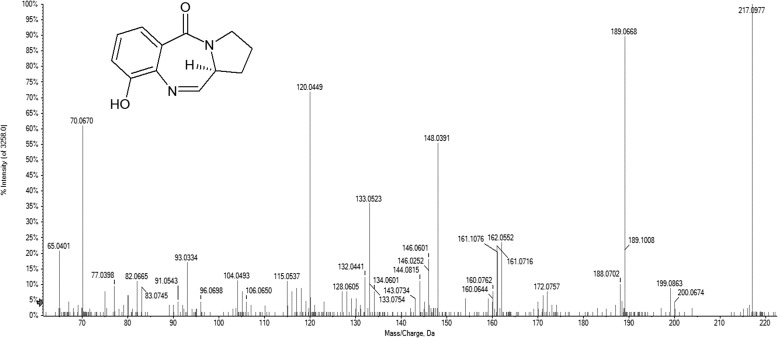
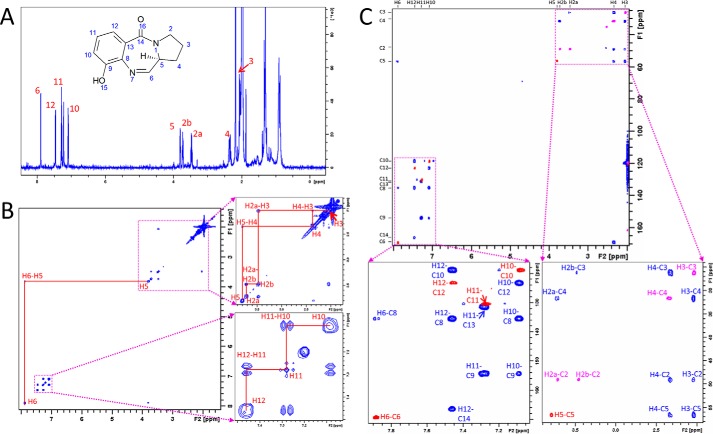
When lyophilized kleboxymycin was reconstituted in acetonitrile-d3, multiple set of signals were initially observed in the NMR spectra (supplemental Fig. S4). The signals gradually became being dominated by one set of signals after standing overnight at 298 K. The last traces of residual signals could be removed by the addition of molecular sieve beads to absorb residual water in the solvent. This observation suggested that the kleboxymycin was slowly dehydrated first by the acetonitrile solvent and then by molecular sieve beads to form a single dehydrated form. However, the dehydrated kleboxymycin was highly unstable because it was readily degraded after standing in the NMR tube for 5 days. The 1H and 13C NMR spectrometry data of the dehydrated kleboxymycin in acetonitrile-d3 at 298 K were presented in supplemental Table S2. MS characterization indicated that dehydrated kleboxymycin has a protonated ion exact mass of 217.0983 in positive ion mode (Fig. 5) and the neutral molecule chemical formula generated with least m/z deviation is C12H12N2O2 (mass accuracy = −2.8 ppm). No other chemical formula with 12 carbon atoms can be fit into this exact mass even if we relaxed the m/z tolerance to 50 ppm. Fig. 6 showed the 1H 1D, COSY, HSQC, and HMBC spectra of dehydrated kleboxymycin. The structure elucidation of dehydrated kleboxymycin follows established methodology of combining the information provided by peak integral, chemical shifts, multiplicity, and cross-peak correlations observed in the COSY, HSQC, and HMBC spectra. H10, H11, and H12 having chemical shifts between 7.08 and 7.45 ppm are three aromatic protons neighboring each other as indicated by their COSY cross-peaks. Their corresponding C10, C11, and C12 carbon chemical shifts are also consistent with these aromatic carbon chemical shifts. The position of the H12 is confirmed by the observation of H12–C14 cross-peak in the HMBC spectrum. H2, H3, H4, H5, and H6 showed another spin system linked by their COSY cross-peaks. C2, C3, C4, and C5 are having aliphatic types of carbon chemical shifts, and their integrals, proton chemical shifts, as well as coupling constants are typical proline side-chain patterns. C6 and H6 are having exceptional high chemical shifts of 169.2 and 7.88 ppm, respectively. These indicate that C6 is having sp2 hybridization. Together with the fact that there is no more feasible aromatic position and aromatic ring, C6 is assigned to be under C=N moiety. C14 has a high carbon chemical shift of 166.4 ppm with no proton attached. This is consistent with a benzoic carbonyl carbon. C8 and C13 are substituted aromatic carbons because they are having aromatic carbon chemical shifts and have no protons attached. C9 has a high aromatic carbon chemical shift of 154.2 ppm, which is consistent with the chemical shift of a phenol carbon chemical shift. Finally, there is a remaining degree of unsaturation, which indicates that dehydrated kleboxymycin should have a three-ring system to form a 7-membered ring in the middle matching the overall chemical structure of a tricyclic pyrrolobenzodiazepine (23). The chemical structure of dehydrated kleboxymycin was shown in Fig. 3C. MS/MS fragmentation analysis on dehydrated kleboxymycin was performed and summarized in supplemental Fig. S5.
Figure 5.
Positive MS/MS spectrum for dehydrated kleboxymycin at m/z 217.
Figure 6.
Resonance assignments of dehydrated kleboxymycin NMR spectra in acetonitrile-d3. A, 1D 1H zg30 spectrum of dehydrated kleboxymycin in acetonitrile-d3 and proton assignments. B, 1H-1H COSY spectrum showing aliphatic protons' (H2–H5) cross-peaks at the region 2–3.8 ppm (right top panel). Aromatic protons' (H10–H12) cross-peaks were observed at the region 7.03–7.51 ppm (right bottom panel). H5 and H6 cross-peaks were also identified. C, 2D 1H-13C HMBC (blue) and HSQC (red for –CH– and pink for –CH2–) overlaid spectrum showing the assignments of carbon without protons attached (C9, C13, and C14).
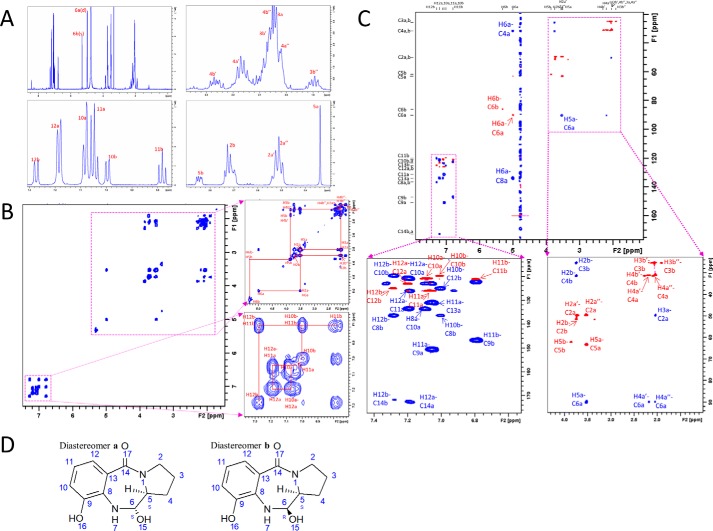
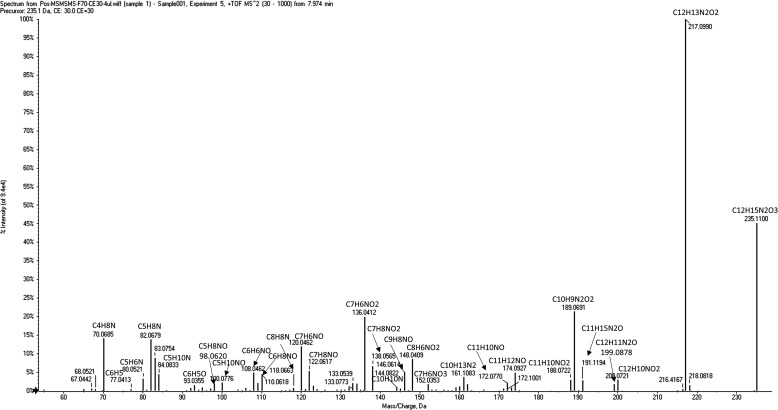
The 1H and 13C NMR spectrometry data of the kleboxymycin in D2O at 298 K are presented in supplemental Table S3 and Fig. 7. MS/MS characterization of kleboxymycin in positive ion mode (Fig. 8) indicated that M − H+ has an exact mass of 235.10784 and the neutral chemical formula generated with least m/z deviation is C12H14N2O3 (mass accuracy = 1.8 ppm). The structural elucidation of kleboxymycin largely followed that of dehydrated kleboxymycin described above except that two sets of NMR signals could be observed in the NMR spectra based on their integrals. The major to minor form has an intensity ratio of about 3:1, and we have named the major and minor forms as diastereomers a and b, respectively. The substitution of the C=N moiety with water has upfield-shifted the C6 carbon chemical shift to 90.9 and 86.2 ppm for diastereomers a and b, respectively. These are consistent with the formation of a hydroxylated C6. H6 has chemical shifts of 4.99 and 5.31 ppm for diastereomers a and b, respectively, which are also consistent with a hydroxyl C6. The H6 showed J coupling splitting of 9.1 and 2.3 Hz with H5 for diastereomers a and b, respectively. Based on these values, the diastereomer a should be having an H6 proton anti to the H5 proton and diastereomer b should be having a H6 proton syn to the H5 proton. Note that the present structure of kleboxymycin is further confirmed by the association experiment of indole with kleboxymycin to form tilivalline described below.
Figure 7.
Resonance assignment of kleboxymycin NMR spectra in D2O. A, 1D 1H zg30 spectrum of kleboxymycin in D2O and proton assignments. Kleboxymycin has two diastereomers a and b as carbon 6 is a chiral center after –OH addition to the double bond. B, 1H-1H COSY spectrum showing aliphatic protons' (H2–H5) cross-peaks at the region 1.8–5.4 ppm (right top panel). Aromatic protons' (H10–H12) cross-peaks were observed at the region 6.70–7.38 ppm (right bottom panel). H5 and H6 cross-peaks were also identified. C, 2D 1H–13C HMBC (blue) and HSQC (red for –CH– and pink for –CH2–) overlaid spectrum showing the assignments of carbon without protons attached (C9, C13, and C14). D, chemical structures of diastereomers a and b of kleboxymycin showing the stereo-isomerism on C6.
Figure 8.
Positive MS/MS spectrum for kleboxymycin at m/z 235.
The 1H spectrum of the P2 (tilivalline) in DMSO at 298 K was presented in supplemental Fig. S6, which matched exactly the reported NMR spectrum of tilivalline (17). MS/MS spectrum of P2 in positive mode was shown in supplemental Fig. S1D. It also showed a product ion at 217 as well as many matching product ions found in the MS/MS spectra of kleboxymycin (Fig. 4) and dehydrated kleboxymycin (Fig. 5) indicating that they have a common chemical skeleton. This is consistent with the chemical structure of tilivalline being an indole derivative of kleboxymycin.
Relative abundance of kleboxymycin and tilivalline in cell culture
To evaluate the relative abundance of kleboxymycin and tilivalline in the cell culture, the levels of kleboxymycin and tilivalline in K. oxytoca MH43-1 culture supernatant at 8 and 12 h were measured by LC-MS quantitative analysis and summarized in Table 2. The relative molar ratios of kleboxymycin to tilivalline were 0.54 and 0.41 at 8 and 12 h, respectively. The corresponding LC-MS extracted ion count plots of kleboxymycin and tilivalline in one of the triplicate sample sets are shown in supplemental Fig. S7.
Table 2.
Kleboxymycin and tilivalline levels in the cultures of WT K. oxytoca at 8 and 12 h
All data were collected as triplicates.
| Strain | Time | Kleboxymycin |
Tilivalline |
Kleboxymycin/tilivalline ratio | ||
|---|---|---|---|---|---|---|
| Average | S.D. | Average | S.D. | |||
| h | μm | μm | μm | μm | ||
| MH43-1 | 8 | 3.1 | 0.3 | 5.7 | 3.5 | 0.54 |
| MH43-1 | 12 | 11.2 | 2.1 | 27.2 | 3.7 | 0.41 |
Gene deletion and complementation
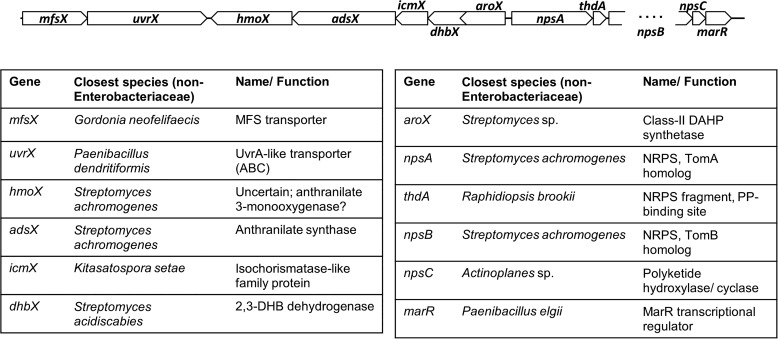
Based on knowledge of the proposed chemical structures of the cytotoxins and comparison among genome sequences of K. oxytoca strains (18), we identified a gene cluster that is likely to be associated with cytotoxin production. Fig. 9 shows the genetic organization of the cytotoxin biosynthesis gene cluster, along with the annotation of predicted gene functions and phylogenetically closest neighbor based on NCBI BLAST search. The organization and annotation of the gene cluster is identical to that described by Schneditz et al. (17), except for the presence of a putative npsC gene which encodes a short protein with sequence similarity to OtcC, a post-polyketide hydroxylase/cyclase. The sequence of kleboxymycin biosynthetic gene cluster is sequenced and has been deposited to GenBankTM and the NCBI accession number is MF401554. Gene deletion and complementation experiments were performed to assess the essentiality of individual genes to cytotoxin production. Results are summarized in Table 3. In all cases, complementation of the deleted gene restored cytotoxicity levels to within 2–4× that of wild type.
Figure 9.
Gene cluster of cytotoxin synthesis. Diagram showing genetic organization of the cytotoxin biosynthesis gene cluster, along with the annotation of predicted gene functions and phylogenetic closest neighbor based on NCBI BLAST search. The predicted function of anthranilate 3-monooxygenase for hmoX does not appear to be supported by our experimental results.
Table 3.
Cytotoxicity of culture supernatants from different deletion mutants of K. oxytoca strain MH43-1, as measured in a cell culture cytotoxicity assay
All cultures were incubated in a shaker at 35 °C and 250 rpm under aerobic conditions for 24 h. The presence of kleboxymycin and tilivalline was assessed by LC-MS/MS analysis.
| Deletion mutant | Cytotoxicity detecteda | Kleboxymycin detected | Tilivalline detected |
|---|---|---|---|
| Within toxin gene cluster | |||
| ΔmfsX | WTa | Yes | Yes |
| ΔuvrX | WT | Yes | Yes |
| ΔhmoX | WT | Yes | Yes |
| ΔadsX | NDa | No | No |
| ΔicmX | WT | Yes | Yes |
| ΔdhbX | ND | No | No |
| ΔaroX | ND | No | No |
| ΔnpsA | ND | No | No |
| ΔthdA | ND | No | No |
| ΔnpsB | ND | No | No |
| ΔnpsC | WT | Yes | Yes |
| ΔmarR | WT | Yes | Yes |
| Outside toxin gene cluster | |||
| ΔtnpA (indole non-producing) | WT | Yes | No |
a WT = wild-type (strain MH43-1); ND = not detected.
Surprisingly, deletion of hmoX, encoding a putative anthranilate 3-monooxygenase, or icmX, encoding a putative isochorismatase-like family protein, did not affect production of kleboxymycin or tilivalline. However, deletion of adsX, encoding an anthranilate synthase, clearly led to a non-toxigenic phenotype as predicted. This suggests that possible functional redundancy for parts of the 3-hydroxyanthranilate biosynthesis operon is compensated by production of a functionally-related enzyme. Alternatively, our functional predictions based on NCBI BLAST analysis may not be accurate, given the lack of highly similar proteins with experimental verification of their enzymatic activity.
Additionally, to further confirm that 3-hydroxyanthranilate is a key intermediate for kleboxymycin biosynthesis in K. oxytoca, exogenous 3-hydroxyanthranilate was added to the culture media at a final concentration of 0.25 g/liter during the culture of the ΔadsX mutant. It was found that the presence of exogenous 3-hydroxyanthranilate could successfully restore cytotoxin production, similar to the effect of genetic complementation (Table 4 and supplemental Fig. S8).
Table 4.
Kleboxymycin and tilivalline levels in the cultures of mutant K. oxytoca at 8 and 12 h
All data were collected as triplicates. 3HA = 3-hydroxyanthranilate.
| Strain | Time | Kleboxymycin |
Tilivalline |
||
|---|---|---|---|---|---|
| Average | S.D. | Average | S.D. | ||
| h | μm | μm | μm | μm | |
| ΔadsX | 8 | 0.0 | 0.0 | 0.0 | 0.0 |
| ΔadsX+3HA | 4.8 | 0.1 | 5.6 | 0.2 | |
| ΔtnpA | 4.4 | 0.4 | 0.0 | 0.0 | |
| ΔadsX | 12 | 0. 0 | 0.0 | 0.0 | 0.0 |
| ΔadsX+3HA | 12.1 | 1.5 | 28.3 | 1.5 | |
| ΔtnpA | 11.0 | 1.1 | 0.0 | 0.0 | |
Finally, we constructed a ΔtnpA mutant that lacks a tryptophanase gene and hence cannot produce indole. LC-MS/MS analysis of its culture supernatant revealed no indole or tilivalline, though kleboxymycin production and cytotoxicity as measured by the cell culture toxicity assay was not affected (Table 4 and supplemental Fig. S9).
Cloning of cytotoxin gene cluster into E. coli
As the cytotoxin gene cluster in K. oxytoca appears to be acquired through an ancient horizontal gene transfer event from an unknown Actinobacteria species, an attempt was made to clone the gene cluster into an E. coli strain to investigate whether another species in the Enterobacteriaceae can support cytotoxin production. Intriguingly, the transformant E. coli was able to produce the cytotoxins in culture supernatant, as shown by cell culture toxicity assay (2× dilution) and LC-MS/MS, albeit at only low levels (Table 5 and supplemental Fig. S10). Kleboxymycin and tilivalline were detected depending on the culture conditions. Using M9 medium with limited indole production, only kleboxymycin was detected in the final cell culture. While using LB medium, only tilivalline was detected, which is consistent with E. coli being an indole producer. Therefore, the present results confirmed that the gene cluster is necessary and sufficient for cytotoxin production.
Table 5.
Kleboxymycin and tilivalline levels of E. coli with cytotoxin gene cluster cultured in M9 and LB media at 24 h
All data were collected as triplicates.
| Medium | Kleboxymycin |
Tilivalline |
||
|---|---|---|---|---|
| Average | S.D. | Average | S.D. | |
| μm | μm | μm | μm | |
| M9 | 0.041 | 0.01 | 0.0 | 0.0 |
| LB | 0.0 | 0.0 | 0.088 | 0.021 |
Total synthesis of kleboxymycin and tilivalline
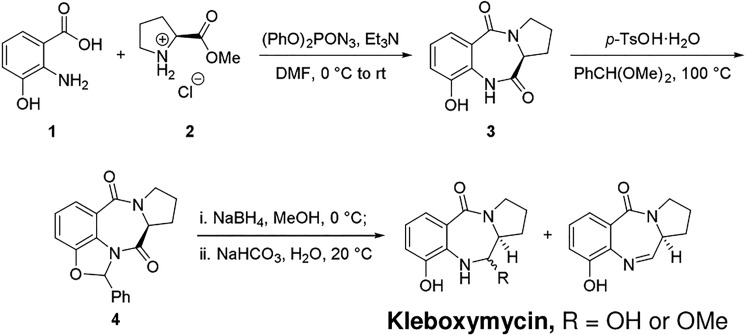
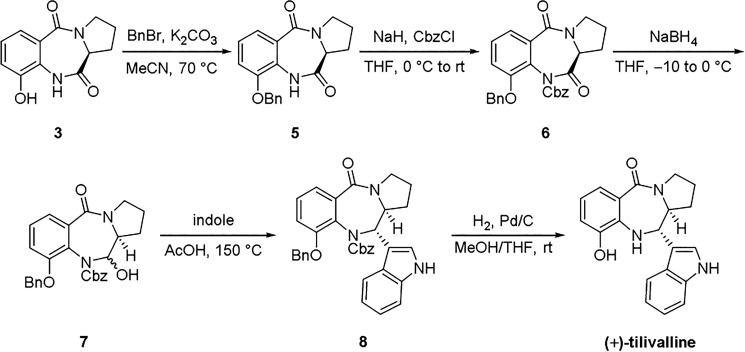
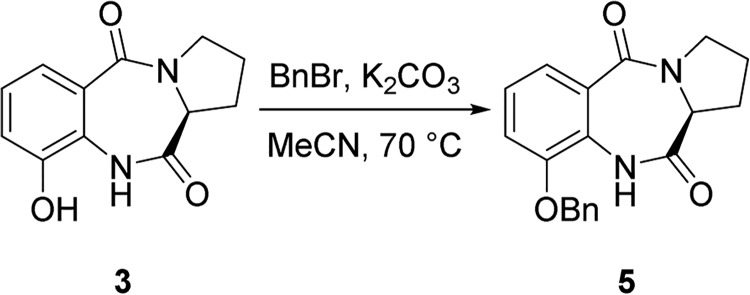
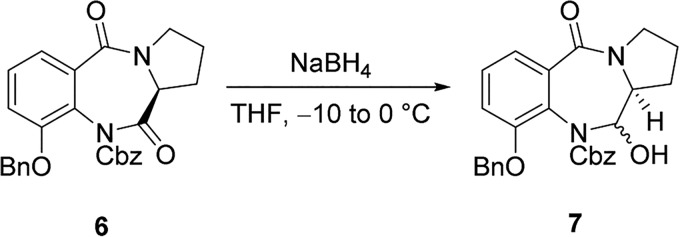
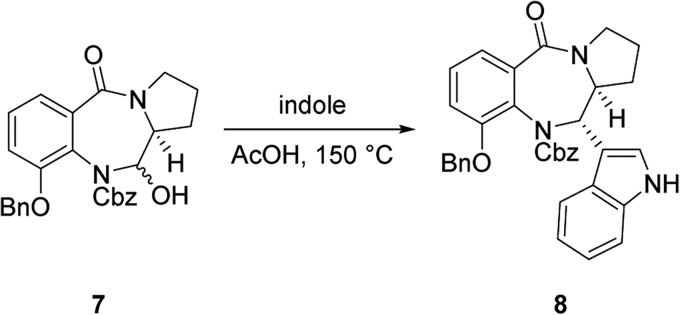
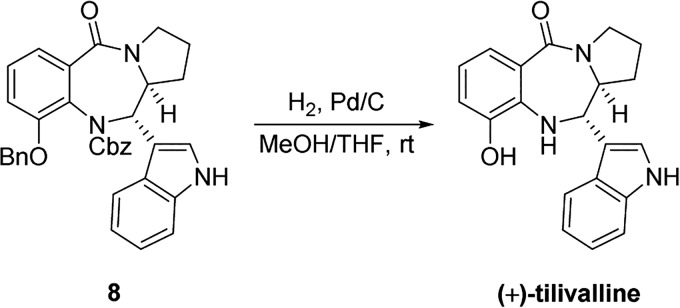
A mixture containing kleboxymycin was prepared in three steps from commercially available 3-hydroxyanthranilic acid 1 and natural l-proline methyl ester 2 (Scheme 1). (+)-Tilivalline was synthesized starting from compound 3 by following published procedures (24) with slight modifications (Scheme 2).
Scheme 1.
Synthesis of kleboxymycin.
Scheme 2.
Synthesis of (+)-tilivalline.
To solution of 1 (1.43 g, 9.34 mmol) and l-proline methyl ester hydrochloride 2 (7.73 g, 46.7 mmol) in anhydrous dimethylformamide (23.3 ml) were added (PhO)2PON3 (6.02 ml, 28.0 mmol) and Et3N (19.5 ml, 140 mmol) under argon atmosphere at 0 °C. Upon completion, the resulting mixture was vigorously stirred under this condition for ∼107 h. The reaction mixture was then loaded onto a silica gel column for flash chromatography purification to provide 3 contaminated with trace amounts of impurities. Recrystallization of this mixture from DCM/EtOH/n-hexane afforded 1.30 g of pure 3 (60% yield) (25).
For compound 3, white solid, m.p. 275–277 °C; analytical TLC (silica gel 60), EtOH/DCM = 10%, Rf = 0.39; [α]25D = 520 (c 0.125, MeOH); 1H NMR (400 MHz, CD3OD) δ 7.33 (dd, J = 7.8, 1.2 Hz, 1H), 7.10 (t, J = 7.9 Hz, 1H), 7.04 (dd, J = 7.9, 1.2 Hz, 1H), 4.16 (d, J = 7.6 Hz, 1H), 3.80–3.71 (m, 1H), 3.61–3.50 (m, 1H), 2.72–2.63 (m, 1H), 2.13–1.92 (m, 3H); 13C NMR (100 MHz, CDCl3) δ 172.4, 167.8, 149.2, 128.9, 126.1, 125.9, 121.5, 118.7, 58.4, 48.4, 27.1, 24.4; IR (CHCl3) νmax 3379, 3003, 2930, 1695, 1628, 1601 cm−1; LRMS (EI, 20 eV) m/z 232 (M+, 15), 167 (26), 149 (88), 69 (100); HRMS (EI) for C12H12O3N2 (M+): calculated 232.0848, found 232.0843.
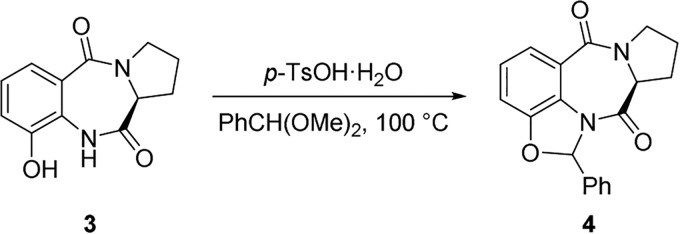
A mixture of 3 (1.25 g, 5.40 mmol) and p-TsOH·H2O (184.9 mg, 0.97 mmol) in PhCH(OMe)2 (30.0 ml) was stirred at ∼100 °C under argon atmosphere for ∼12 h. The resulting mixture was loaded onto a silica gel column for flash-chromatography purification to provide ∼1.74 g of 4 (∼100% yield) containing a small amount of impurities, which was employed for the next step directly. A small fraction of pure 4 was collected for structural characterization.
For compound 4, sticky amorphous solid; analytical TLC (silica gel 60), EtOH/DCM = 5%, Rf = 0.54; [α]25D = 444 (c 0.098, CHCl3); 1H NMR (400 MHz, CDCl3) δ 7.56 (d, J = 8.0 Hz, 1H), 7.46–7.39 (m, 2H), 7.39–7.32 (m, 3H), 7.30 (s, 1H), 7.17 (t, J = 8.0 Hz, 1H), 7.07 (d, J = 7.8 Hz, 1H), 4.18–4.10 (m, 1H), 3.78–3.64 (m, 2H), 2.92–2.81 (m, 1H), 2.17–1.84 (m, 3H); 13C NMR (100 MHz, CDCl3) δ 169.8, 165.3, 150.8, 136.7, 130.0, 128.9, 127.2, 125.9, 125.6, 121.9, 121.5, 112.2, 94.6, 58.9, 48.0, 27.0, 23.4; IR (CHCl3) νmax 3019, 2928, 1694, 1628, 1601 cm−1; LRMS (EI, 20 eV) m/z 320 (M+, 36), 292 (24), 223 (24), 195 (100); HRMS (EI) for C19H16O3N2 (M+): calculated 320.1161, found 320.1147 (Scheme 3).
Scheme 3.
To a solution of 4 (961.0 mg, 3.00 mmol) in methanol (300 ml) was added NaBH4 (567 mg, 15.0 mmol) in one portion under argon atmosphere at 0 °C. The resulting mixture was stirred under this condition for ∼1 h. Then another portion of NaBH4 (567 mg, 15.0 mmol) was added, and the resulting mixture was stirred under the same condition for another 1 h. Upon completion, the reaction mixture was diluted with methanol (2.7 liters) and quenched with NaHCO3 (3.00 g, 35.7 mmol) in water (300 ml). The stirring was continued at room temperature overnight, and then evaporated under reduced pressure (20 °C water bath, water pump). The resulting brownish aqueous mixture was azeotroped with acetonitrile to remove most of the water and was subjected to solid-phase extraction and reversed-phase chromatography as the culture metabolites described under “Experimental procedures.” The final purified kleboxymycin product was lyophilized and stored as a white powder at −80 °C (Scheme 4).
Scheme 4.
To a mixture of 3 (0.50 g, 2.1 mmol) and anhydrous K2CO3 (0.59 g, 4.3 mmol) in MeCN (10.7 ml) was added BnBr (0.26 ml, 2.2 mmol) under argon atmosphere at room temperature. Upon completion, the resulting mixture was stirred at ∼70 °C for ∼12 h. Then the reaction mixture was filtered through a celite pad. The filtrate was evaporated, and the residue was purified by chromatography to afford 0.69 g of 5 (100%) (1).
For compound 5, white solid; analytical TLC (silica gel 60), EtOH/DCM = 5%, Rf = 0.38; [α]25D = 393 (c 1.00, CHCl3); 1H NMR (400 MHz, CDCl3) δ 7.97 (br s, 1H), 7.59 (d, J = 7.9 Hz, 1H), 7.44–7.33 (m, 5H), 7.18 (t, J = 8.0 Hz, 1H), 7.10 (d, J = 8.1 Hz, 1H), 5.13 (s, 2H), 4.04 (d, J = 6.2 Hz, 1H), 3.86–3.77 (m, 1H), 3.66–3.56 (m, 1H), 2.82–2.69 (m, 1H), 2.11–1.95 (m, 3H); 13C NMR (100 MHz, CDCl3) δ 170.5, 165.3, 147.8, 135.6, 129.0, 128.8, 127.9, 127.6, 125.7, 124.8, 122.9, 114.6, 71.5, 57.0, 47.5, 26.4, 23.6 (Scheme 5).
Scheme 5.
To a solution of 5 (0.63 g, 1.95 mmol) in anhydrous THF (39 ml) was added LiHMDS (1 m in THF, 2.93 ml, 2.93 mmol) dropwise at room temperature under argon atmosphere. Upon completion, the reaction mixture was stirred under this condition for ∼50 min. Then CbzCl (418 μl, 2.93 mmol) was added under argon atmosphere, and the resulting mixture was stirred under this condition for ∼2 h. Saturated NaHCO3 aqueous solution was subsequently added to quench the reaction, and the mixture was extracted with DCM. The combined organic layer was dried over anhydrous Na2SO4, filtered, and evaporated, and the residue was purified by silica gel chromatography to afford 0.83 g of 6 (93% yield) (Scheme 6).
Scheme 6.
To a solution of 6 (1.00 g, 2.2 mmol) in anhydrous THF (136 ml) was added NaBH4 (91.6 mg, 2.42 mmol) in one portion under argon atmosphere at −10 °C (ice/acetone bath). The resulting mixture was stirred under this condition for ∼2 h while the bath temperature increased gradually from −10 to 0 °C. Then saturated NH4Cl aqueous solution was added to quench the reaction. The reaction mixture was extracted with DCM, and the combined organic layer was dried over Na2SO4, filtered, and evaporated. The residue was purified by silica gel chromatography to afford 0.73 g of 7 (72% yield) (Scheme 7).
Scheme 7.
A mixture of 7 (0.53 g, 1.2 mmol) and indole (0.68 g, 5.8 mmol) in AcOH (26 ml) was cooled to freeze under an argon atmosphere. Then the reaction flask was evacuated with an oil pump and sealed. It was then warmed slowly until all the solid disappeared. Argon was introduced subsequently, and the freeze-and-thaw procedure was repeated another two times. Upon completion, the reaction flask was sealed, and the reaction mixture was stirred at 150 °C for 5 h. AcOH was removed by repeatedly azeotroping with toluene 3 times. The residue was purified by silica gel chromatography to afford 0.64 g of 8 (99% yield) (Scheme 8).
Scheme 8.
To a solution of 8 (0.64 g, 1.2 mmol) in methanol (18 ml) and anhydrous THF (18 ml) was added Pd/C (10 weight %, 0.24 g, 0.23 mmol) under argon atmosphere at room temperature. Then a H2 balloon was installed via a T-type stopcock. The reaction flask was evacuated with a water pump and refilled with H2 several times. Upon completion, the resulting mixture was vigorously stirred at room temperature for 21 h. The mixture was then filtered through a celite pad and eluted with methanol. The filtrate was evaporated, and the residue was purified by silica gel chromatography to afford 0.37 g of (+)-tilivalline (97% yield) with a trace amount of impurity. The product was further purified by recrystallization from MeCN to afford 93.8 mg of pure (+)-tilivalline (24% yield).
For (+)-tilivalline, light pink solid; analytical TLC (silica gel 60), EtOH/DCM = 5%, Rf = 0.23; [α]25D214 (c 0.39, MeOH); 1H NMR (400 MHz, CD3OD) δ 7.38–7.29 (m, 3H), 7.18 (s, 1H), 7.07 (t, J = 7.6 Hz, 1H), 6.90 (t, J = 7.5 Hz, 1H), 6.85 (dd, J = 7.6, 1.0 Hz, 1H), 6.67 (t, J = 7.9 Hz, 1H), 4.72 (d, J = 9.4 Hz, 1H), 4.22–4.13 (m, 1H), 3.80–3.63 (m, 2H), 1.95–1.81 (m, 1H), 1.74–1.52 (m, 3H); 13C NMR (100 MHz, CDCl3) δ 170.4, 147.2, 138.4, 136.6, 126.5, 124.3, 122.9, 122.6, 121.6, 120.2, 120.2, 118.7, 117.6, 116.8, 112.6, 63.5, 61.6, 48.9, 31.2, 23.4.(Scheme 9).
Scheme 9.
Toxicity of kleboxymycin
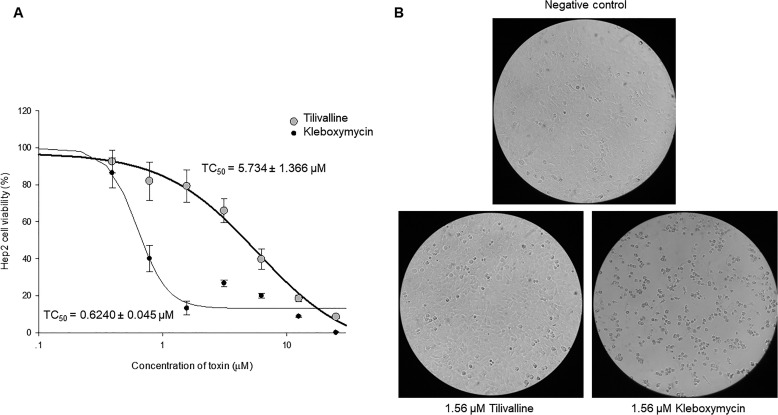
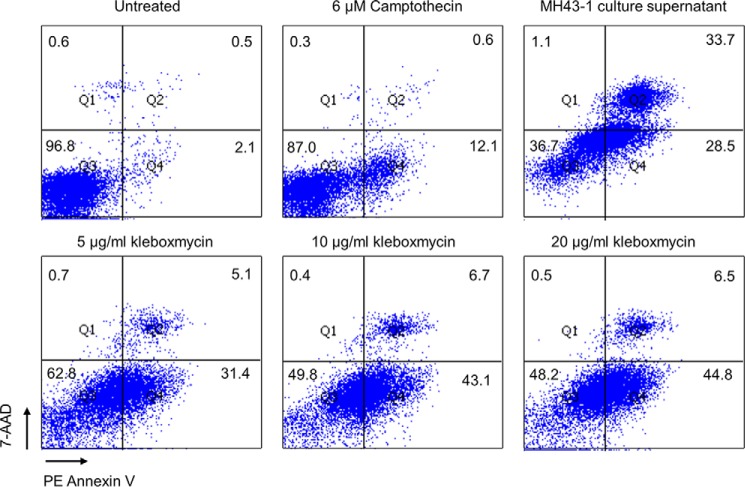
The cytotoxicity of kleboxymycin and tilivalline was evaluated by measuring the TC50 of the synthetic compounds in an MTT-based cell culture assay. As shown in Fig. 10, the toxicity of kleboxymycin is significantly higher than tilivalline by at least 9-fold. As the K. oxytoca cytotoxin had been reported to mediate its cytotoxicity through induction of apoptosis, we sought to assess whether kleboxymycin also mediates cell death through a similar mechanism. Results of a PE annexin V apoptosis assay are shown in Fig. 11 and support that kleboxymycin is a strong inducer of apoptosis. PE annexin V is a sensitive probe for identifying apoptotic cells that bind to the membrane phospholipid PS. In early stage of apoptosis, PS is translocated from the inner to the outer leaflet of plasma membrane, exposing it to PE annexin V. 7-AAD is a vital dye. Viable cells with intact membranes exclude 7-AAD, whereas damaged cells and dead cells are permeable to 7-AAD. In Fig. 11, untreated cells were viable (both PE annexin V and 7-AAD were negative), whereas cells treated with kleboxymycin were undergoing apoptosis (PE annexin V positive, 7-AAD negative). Camptothecin serves as a positive control of apoptosis inducer.
Figure 10.
Cytotoxicity of kleboxymycin and tilivalline. A, results of cytotoxicity assessment (TC50) from an MTT-based cell culture assay, showing a >9-fold lower TC50 value of kleboxymycin relative to tilivalline. B, CPE of 1.56 μm tilivalline and 1.56 μm kleboxymycin on HEp-2 cells on day 2 post-treatment. Cells exposed to tilivalline show minimal CPE relative to minimal control, but those treated with kleboxymycin showed significant cell rounding. ×20 magnification.
Figure 11.
Results of a PE annexin V apoptosis assay showing kleboxymycin as a strong inducer of apoptosis.
Kleboxymycin can readily associate with indole to form tilivalline
Kleboxymycin is a labile molecule because it can be converted to the dehydrated kleboxymycin (supplemental Fig. S4) and methoxy-kleboxymycin (supplemental Fig. S11) readily when dissolved in acetonitrile and methanol solvent, respectively. To test whether kleboxymycin can associate with indole to form tilivalline directly, we have incubated kleboxymycin with indole at different molar ratios. The results are summarized in supplemental Table S4 and supplemental Fig. S12. No tilivalline could be detected in the control samples of pure indole and pure kleboxymycin. Tilivalline could be detected in the kleboxymycin mixture with indole, and the levels of tilivalline increased proportionally with the increasing molar ratios of indole/kleboxymycin. The equilibrium was reached rapidly because no changes on the tilivalline levels could be observed over a period of 4 h. The spontaneous dissociation of tilivalline was also tested and summarized in supplemental Table S5 and supplemental Fig. S13. Freshly prepared pure tilivalline of 0.04 mm showed no signs of dissociation to kleboxymycin. Detectable level of kleboxymycin at 0.0016 mm was observed after 60 days incubation at 298 K.
Discussion
The identity of the K. oxytoca cytotoxin has been a topic of interest for many years, but past studies have produced ambiguous results. The latest results from Schneditz et al. (17) and Darby et al. (18) appeared to have settled the question, but our present results revealed additional complexity. We demonstrated that kleboxymycin is the primary product of a nonribosomal peptide synthesis pathway in K. oxytoca. Coincidentally, because K. oxytoca is an indole-producing bacterium, a significant amount of kleboxymycin would react with indole to form the stable derivative tilivalline even in pure culture. This resulted in a confusing situation as the cytotoxicity phenotype, tilivalline and kleboxymycin levels, would appear to correlate experimentally, regardless of the contribution of tilivalline and kleboxymycin to cytotoxicity. Our construction of an indole-negative ΔtnpA mutant of cytotoxin-producing K. oxytoca and testing of synthetic kleboxymycin proved that kleboxymycin alone is sufficient to induce cytotoxicity in the HEp-2 cell culture assay. Regrettably, as kleboxymycin can react with indole present within HEp-2 cells to form tilivalline, it is not possible to eliminate the contribution of tilivalline to cytotoxicity by conventional experiments. Similarly, any animal or clinical experiments involving kleboxymycin would inadvertently produce tilivalline in vivo, due to the presence of a significant amount of indole produced by intestinal microbiota (26), which can enter intestinal tissue (27). Hence, experimental assessment of the independent cytotoxicity of each molecular species would likely require a novel and innovative approach to circumvent this significant limitation.
Nonetheless, fundamental consideration of the chemical and toxicological properties of kleboxymycin versus tilivalline argues for a greater role of kleboxymycin than tilivalline in causing cytotoxicity. Known PBDs are DNA minor groove binders with covalent interactions with base residues, and their binding can interfere with normal cellular activity like DNA transcription and replication. Based on the proposed mechanism for anthramycin deoxyguanosine adduct formation and previous structure–activity studies, it is inferred that the presence of an imine or carbinolamine methyl ether at the N7–C6 position of the basic PBD skeleton is important for DNA adduct formation. Kleboxymycin fits nicely with the proposed mechanism with an imine moiety at N7–C6 (in the dehydrated form) (Fig. 3C), whereas the same position is occupied by the indole substituent in tilivalline. Schneditz et al. (17) agreed that tilivalline is unlikely to cause cytotoxicity via the same mechanism, and the proposed interaction between tilivalline and DNA is supported only by indirect evidence such as induction of apoptosis. Furthermore, in the course of our studies, we observed in vitro degradation of tilivalline slowly into kleboxymycin and related molecules to a limited degree (supplemental Table S5). Hence, it may be possible that kleboxymycin and tilivalline can interconvert in vivo, with kleboxymycin being the more toxic species directly interacting with DNA. Further studies on the direct interactions of kleboxymycin and tilivalline with DNA may help to clarify their role and contribution to the cytotoxicity.
Prior to the present discovery of kleboxymycin, all known natural tricyclic PBDs were produced by members of the Actinobacteria. As pointed out by Schneditz et al. (17), the kleboxymycin biosynthetic gene cluster in K. oxytoca is not native to the Enterobacteriaceae and was most likely acquired through horizontal transfer. Bioinformatic analysis suggested that the genes might have been acquired from Xenorhabdus spp., which in turn had acquired them from the Actinobacteria. In particular, the PBD biosynthetic gene cluster in the genome of Xenorhabdus nematophila F1 has an identical organization with the kleboxymycin biosynthetic gene cluster, whereas the PBD biosynthetic gene clusters of Streptomyces spp. are considerably larger (≥25 kb) and contain more genes (≥18). The differences in size and gene count of the biosynthetic gene clusters are reflected in the complexity of the products; kleboxymycin is one of the two smallest natural PBDs identified to date and contains only a single C6 hydroxyl substituent on the basic tricyclic PBD backbone. A related question of interest is whether K. oxytoca and possibly X. nematophila are unique among Enterobacteriaceae to support PBD biosynthesis, as it is generally difficult to achieve good heterologous expression of similar biosynthetic gene clusters, like in the case of erythromycin biosynthesis in Escherichia coli. Alternatively, the kleboxymycin biosynthetic genes might have undergone adaptation for expression in Enterobacteriaceae. Further studies in this area may lead to discoveries that can improve industrial-scale biosynthetic production of complex natural products. Although cytotoxin production in K. oxytoca has only been associated with the specific syndrome of AAHC, we speculate that the toxin might also enhance the virulence of the organism in other types of infections. None of the tricyclic PBDs produced by the Actinobacteria have been associated with human or animal disease, but both natural and synthetic PBDs are known for their broad-spectrum anti-neoplastic activity. The major adverse effects associated with PBDs in clinical trials are intestinal necrosis and cardiotoxicity. Based on the structure–activity relationship of tricyclic PBDs, kleboxymycin is also predicted to be cardiotoxic, due to the presence of the C9 hydroxyl substituent. Hence, it is possible that cytotoxin production may exacerbate cardiovascular collapse in the setting of septic shock and possibly lead to increased mortality. Further study is warranted to investigate possible linkage between cytotoxin production and adverse clinical outcomes in K. oxytoca infections.
In summary, a novel natural PBD cytotoxin has been identified in specific K. oxytoca strains. Importantly, our work reconciled conflicting results from past studies, which were sometimes confused by the effects of cytotoxin derivatives versus that of the primary cytotoxin. It is hoped that correct identification of the major cytotoxic metabolites would enable future studies into the molecular mechanisms of actions of these toxins and lead to applications with clinical utility.
Experimental procedures
Bacterial strains and culture conditions
K. oxytoca MH43-1 was used as a cytotoxin-producing control strain and was a kind gift from Prof. Christoph Högenauer at the Medical University of Graz, Austria. Other K. oxytoca strains were isolated from clinical specimens in Queen Mary Hospital, Hong Kong, and include strains described in our previous study. Identities of all isolates were confirmed by standard biochemical methods and matrix-assisted laser desorption/ionization time-of-flight MS analysis.
Unless otherwise stated, for culturing of K. oxytoca in broth, one colony was selected from a pure growth on horse blood agar or LB agar and inoculated into 10 ml of a tryptone/lactose-based medium (tryptone/lactose broth) with the following composition: 17 g/liter tryptone (Sigma), 10 g/liter lactose (Sigma), and 2.5 g/liter dipotassium hydrogen phosphate (Sigma). Unless otherwise stated, the inoculated broth was then incubated for 24 h at 35 °C and agitation at 250 rpm.
E. coli with cytotoxin gene cluster culture conditions
For culturing E. coli with cytotoxin gene cluster, single colony was selected from LB agar supplemented with 12.5 μl/ml chloramphenicol and inoculated into 3 ml of M9 minimal (or LB) medium supplemented with 12.5 μl/ml chloramphenicol and 500× CopyControl Fosmid Autoinduction Solution (Epicenter, WI) at 37 °C overnight at 250 rpm. 10 μl of overnight culture was then added to 10 ml of M9 minimal (or LB) medium supplemented with 12.5 μl/ml chloramphenicol and 500× CopyControl Fosmid Autoinduction Solution (Epicenter, WI) for 24 h with shaking at 250 rpm.
Cell culture cytotoxicity assay
Cytotoxin production in K. oxytoca was assayed by a previously established cell-culture assay (5, 8), with modifications to the original bacterial culture conditions. 105 HEp-2 cells were seeded into each well of a 96-well plate and incubated for 48 h in minimal essential medium (MEM) containing 10% fetal bovine serum, 100 units/ml penicillin, 100 μg/ml streptomycin, and 31.25 μg/ml gentamicin. Broth cultures of K. oxytoca were prepared as stated above. After centrifugation at 20,000 × g for 10 min at 4 °C, the supernatant was filtered through a membrane filter with a pore diameter of 0.2 μm (Millipore, MA). An equal volume of MEM was mixed with the filtrate (1:1 dilution with phosphate-buffered saline) and inoculated onto HEp-2 cells, followed by incubation in 5% CO2 at 37 °C for up to 48 h. Cytotoxicity was defined as presence of cytopathic effects (CPE) manifested as cell rounding or death that were observed with a light microscope. When 50% or more of the cells are seen to have rounded up or detached under the low power field, it is defined as a positive CPE score.
TC50 determination
For quantitative determination of cytotoxicity of filtered culture supernatants, purified toxin fractions, or synthetic toxins, MTT-based cytotoxicity assays similar to a previously reported assay (17) were performed. 1.50 × 10⁴ HEp-2 cells were seeded on flat-bottomed, 96-well cell culture plates and maintained at a total volume of 100 μl of MEM with 10% FBS. The culture plates were placed in an incubator with 5% CO2 at 37 °C for 24 h until the cells had reached 70–80% confluency. Culture media were then removed, followed by washing of cells once with 100 μl of plain MEM and replenishment with 50 μl of MEM containing 2% FBS. 50 μg/ml amikacin and meropenem were also added to the culture medium. We performed serial 2-fold dilution of test materials with plain MEM and transferred 50 μl of diluted supernatant into each well. Hence, the final medium contained 1% FBS in concentration and 25 μg/ml of amikacin and meropenem. The plate was wrapped with aluminum foil and placed in an incubator with 5% CO2 at 37 °C for 2 days. CPE as mentioned above was recorded at 24 and 48 h. At the end of the assay, 10 μl of a 5 mg/ml MTT solution was added into each well and incubated for 4 h, and then 100 μl of 10% of sodium lauryl sulfate with 0.01 m hydrochloric acid was added to solubilize the MTT crystal overnight. MTT data were recorded at optical densities of 570 and 640 nm by DTX880 plate reader (Beckman Coulter, CA). TC50 was calculated and curve plotted with SigmaPlot (Systat Software, IL).
Separation and purification of compounds P1 and P2
The separation and purification strategy used to purify the top two bioactive compounds as identified through multivariate analysis is shown in Fig. 2. The mass to charge ratio and retention time of the two chemical species were used as the identifiers to trace their location during their purification. An Oasis HLB solid-phase extraction cartridge was first conditioned with 12 ml of MeOH, followed by 12 ml of H2O. 10 ml of culture media was loaded onto the column, and the metabolites were eluted in three successive fractions. The first fraction (F1) was eluted using 20 ml of H2O, fraction 2 (F2) with 10 ml of MeOH:H2O (1:1), and fraction 3 (F3) with 10 ml of MeOH. A sample of each fraction was subjected to LC-MS/MS analysis, and F2 was determined to contain compound 1. A total of 1 ml of F2 was further resolved by HPLC-DAD on a Keystone Hypersil C18 column (4.6 × 250 mm) using 10 injections (100 μl per injection). For each injection, isocratic elution at 10% ACN was used to elute the fraction containing compound 1 at a retention time of 10 min (referred to as peak 1, P1). All the eluent from the C18 column, with exception of the fraction containing P1, was pooled together, and this was combined with F1. This combined fraction was referred to as fraction O (other part of eluent). LC-MS/MS analysis determined that F3 contained compound 2 with a sufficient purity that further separation was not required and was now referred to as peak 2 (P2). The fractions P1, P2, and O were subjected to rotatory evaporation to concentrate them and then diluted to a final volume of 4 ml in H2O. For the subsequent CPE cytotoxicity toxicity tests where the combined fractions were examined, P1 + P2 + O was generated by pooling equal volumes of the individual fractions together. P1 + P2 was made by adding equal volumes of P1, P2, and H2O together. When testing individual fractions (P1, P2, and O), 1 volume of the corresponding fraction was mixed with 2 volumes of H2O. All the fractions were stored at 4 °C until they were examined using the CPE cytotoxicity tests.
LC-MS/MS analysis
Analysis of the culture supernatant was performed on an Agilent 1100 series HPLC system (Agilent Technologies, CA) coupled to a triple quadrupole-linear ion trap mass spectrometer (QTRAP; AB Sciex, Canada) with a TurboIon Spray ion source set with positive mode. Agilent 1100 series degasser, pump, and autosampler were used in conjunction with an Agilent eclipse XDB C18 (150 × 2.1 mm, 3.5 μm) analytical column. 10 μl of sample was injected by the autosampler in each run with a linear gradient elution at a flow rate of 200 μl/min. The mobile phase was initially run at 100% A for 5 min and then the organic content was increased linearly to 100% B within 20 min. The column was then flushed with 100% ACN for 14.5 min and back to 100% water in 30 s. Finally, the column was reconditioned using 100% water for 20 min. Mobile phase A was 0.1% formic acid in water and mobile phase B was 0.1% formic acid in ACN.
In the electrospray ionization (ESI) setting, the curtain gas, nebulizing gas, and auxiliary gas were set to 20, 60, and 60 units, respectively. Auxiliary gas temperature was set at 350 °C, and the ion spray voltage was 5500 V. Information-dependent acquisition (IDA) was implemented, and enhanced MS (EMS) mode was used for the survey scans. Four enhanced product ion (EPI) scans were used as the dependent scan. The two most intense peaks picked from each EMS were subjected to EPI with two different collision energies (CE = 20 or 40 V), whereas CE setting was 10 V in EMS. To prevent the acquisition of redundant spectra, the same peaks in EMS would not be selected by IDA in the following 60 s after five occurrences. The mass range used in EMS was m/z 100–500 and that in EPI was m/z 50–500. The linear ion trap filling time was set to 50 ms in any of the scans with Q0 trapping turned on. Scanning rates of EMS and EPI were both set at 4000 atomic mass units/s. Enhanced resolution mode was also used to confirm the charge state of +1. The declustering potential (DP) was set to 50 in each of the scans.
LC-MS/MS data processing and multivariate analysis
Markerview software 1.2.1 (AB Sciex, CA) was used for LC-MS peak finding and peak alignment (28). Peaks were found with the minimum retention time set to 1.5 min, minimum spectral width of 0.6 Da, and noise threshold of 1 × 10⁵ counts/s. For peak alignment, the retention time tolerance and mass tolerance were set to 5.0% and 0.2 Da, respectively. A 12 × 3647 (row × column) data matrix with peak areas and toxicity values was generated for multivariate analysis using SIMICA-P 13.0 (Umetrics, Sweden). For each row, it represents the four different samples, each with three replicates. For each column, it represents the identified LC-MS peaks depicted with a unique pair-identifier (the mass to charge ratio and retention time). The final column in the data matrix represents the toxicity values derived from the MTT assay using the culture media. PCA model was used to identify outliners, and a supervised PLS model was employed to correlate LC-MS profiling data with corresponding toxicity data. The model was generated using the autofitting option with pareto scaling (19). Peakviewer software 2.0 (AB Sciex, CA) was used to process the high resolution MS data and Formula Finder was used to generate the potential molecular formulas of the identified compounds (29).
High resolution LC-MS/MS analysis for accurate mass determination
To determine the accurate mass for compound P1 and P2, Agilent 1200 series nano-pump equipped with a 10-well plate auto-sampler (Agilent Technologies) was connected to TripleTOF 5600 system fitted with a Nanospray III source (AB SCIEX, Canada) used in positive mode. The RP trap (150-μm inner diameter × 50-mm length) and RP nano-columns (75-μm inner diameter × 150-mm length) were packed in-house with Jupiter C18 packing materials using an ultrahigh-pressure syringe pump operating in constant pressure mode (up to 6000 p.s.i.). 5 μg of compounds P1 and P2 were mixed together, loaded onto RP trap column, and then eluted on the RP nano-column with a binary solvent system consisting of solvent A (H2O with 0.1% formic acid) and solvent B (ACN with 0.1% formic acid) at a flow rate of 300 nl/min. The total run time was 50 min with the following gradient conditions: 0–5 min, 0% B; 5.1–35 min, 0–100% B; 100% B hold for 10 min; 45.1–46 min, 100–2% B, 2% B hold for 19 min. A calibration delivery system was used to ensure the accuracy of mass to less than 20 ppm. Parameters were the following: nebulizer gas, 10 p.s.i.; curtain gas, 30 p.s.i.; heater gas, 0 p.s.i.; ion spray voltage floating, 2800 V, and interface heater temperature, 125 °C. An IDA method was created to acquire both MS and MS/MS data. TOF MS spectra were acquired with the range m/z 100–1000 Da and 0.25-s ion accumulation time, DP at 30 V and CE at 10 V. Peak intensity, more than 1 cps; charge state was set +1; excluding the former target ion for 6 s; excluding isotopes within 4.0-Da range; maximum number of candidate ions to monitor per cycle, 20; mass tolerance, 50 mDa; and dynamic background subtraction was on; product ion spectra were acquired with the range m/z 50–1000 Da, and 0.25 s ion accumulation time, DP at 30 V and CE at 30 V.
GC-MS analysis
GC-MS analysis was performed on an Agilent 7890A gas chromatography instrument coupled to an Agilent 5975C mass spectrometer using Agilent ChemStation software (Agilent Technologies). Heliflex AT-5 capillary column (30-m × 0.25-mm inner diameter × 0.25-μm (film thickness)) with (5% phenyl)-95% methoxpolysiloxane phase (Grace, IL) was used for separation. Temperature program began at 50 °C, held for 5 min, then increased from 50 to 200 °C at 10 °C/min and held for 5 min. Split-less injection was conducted, and high purity grade helium (99.995%) was used as carrier gas with a flow rate of 1.0 ml/min. The MS spectrometer was operated in EI mode; the scan range was 20–350 atomic mass units; the ionization energy was 70 eV; and the scan rate was 4.27 scans/s. The inlet, auxiliary heater, ion source, and quadrupole temperatures were set at 180, 180, 280, and 150 °C, respectively.
NMR spectroscopy analysis
For the NMR measurement of dehydrated kleboxymycin, lyophilized kleboxymycin was reconstituted in acetonitrile-d3 with the addition of molecular sieve beads to remove residual water in the sample and the solvent. The sample was monitored with time by ZG30 1D proton NMR experiment until the kleboxymycin was fully dehydrated after about 24 h. For the NMR measurement of kleboxymycin, lyophilized kleboxymycin was reconstituted in 100% D2O with 43.7 mm trimethylsilylpropanoic acid (TMSP, Sigma). The following experiments, ZG30, homonuclear 2D experiments COSY (cosyesgpqfpr), TOCSY (dipsi2esgpph1), and heteronuclear 2D experiments HSQC (hsqcefgpsisp2 and hsqcedetgpsisp2.3) and HMBC, were acquired at 298 K on a Bruker Avance 600 MHz NMR spectrometer (1H and 13C frequencies of 600.133 and 150.916 MHz, respectively) equipped with a 5-mm BBI probe with Z-gradient using standard Bruker pulse sequences. Data were acquired and analyzed using Topspin 3.1 (Bruker). Chemical shifts are given on a ppm scale and coupling constants are reported in Hz. All 1H chemical shifts were referenced to residual acetonitrile methyl resonance at 1.95 ppm for dehydrated kleboxymycin or TMSP methyl resonance at 0 ppm for kleboxymycin sample. Chemical shifts of 13C were referenced indirectly by gyromagnetic ratio method (30). A pulse length of 7.97 and 15.94 μs was used for 1H and 13C, respectively. Data of ZG30 were acquired at 64,000 points with spectral width of 12,335.526 Hz. Free induction decays were multiplied with an exponential line-broadening function of 0.3 Hz before Fourier transformation. For two-dimensional 1H-1H and 1H-13C experiments, the sizes of F2 dimension were 2048 points and that of F1 dimension was 512 points, which were Fourier-transformed into 2048 × 1024 points. Spectral width of COSY was 9615.385 Hz × 9014.423 Hz; HSQCETGPSISP was 8971.292 Hz × 25000.000 Hz; HMBC was 12019.230 Hz × 33195.164 Hz for F2 and F1, respectively.
Gene deletion and complementation
Gene deletion mutants of K. oxytoca were constructed using the Lambda Red recombination system (31, 32). Oligonucleotide sequences used are listed in supplemental Table S6. Briefly, cells harboring pSIM5 were grown to the mid-log phase and induced by thermal inactivation of the λ cI857 repressor at 42 °C for 15 min. Cells were made electrocompetent and transformed with PCR products containing the kanamycin-resistance cassette flanked by 500-bp flanking regions of the target gene. Transformant colonies carrying the desired modification were directly selected on kanamycin-containing LB agar. The target region was PCR-amplified and sequenced to confirm site-specific modification. The kanamycin cassette was then removed using the Cre recombinase system borne on the plasmid 705-Cre (33, 34). To confirm that the resultant phenotypic changes were due to gene deletion, complementation was performed by inserting target genes into plasmid pCRII or pCR-XL (Invitrogen) by Taq-amplified cloning.
Cloning of cytotoxin biosynthesis gene cluster
A 17.5-kb DNA fragment encompassing the complete K. oxytoca cytotoxin biosynthesis gene cluster was first amplified by PCR using forward primer 5′-GGCAAGATATCCGACTCGTTGTTT-3′ and reverse primer 5′-GCAAAGGAATAAGCAAGAAGGGAA-3′. PCR was performed in a 25-μl reaction mix containing bacterial DNA as template, iProof GC buffer, 200 μm of each dNTP, and 0.02 units of iProof High Fidelity DNA polymerase (Bio-Rad). Cycling conditions were as follows: initial denaturation at 98 °C for 1 min, followed by 40 cycles of 98 °C for 10 s, 58 °C for 30 s, and 72 °C for 7 min in an automated thermal cycler (Applied Biosystems). The PCR product was subjected to 5′-phosphorylation using T4 polynucleotide kinase (New England Biolabs) for 30 min at 37 °C and then cloned into CopyControl pCC2FOS (Epicenter) according to manufacturer's instructions. Briefly, 5′-phosphorylated PCR product was ligated into CopyControl pCC2FOS cloning-ready vector using Fast-Link DNA ligase at 16 °C overnight, and the resultant plasmid was packaged into MaxPlax Lambda Packaging Extracts, EPI300-T1R Plating Strain. Single colonies were selected on LB plate supplemented with 12.5 μl/ml chloramphenicol at 37 °C overnight.
Apoptosis assay
Induction of apoptosis was assessed using the PE annexin V apoptosis detection kit I (BD Biosciences) according to the manufacturer's instructions. Briefly, 2 × 10⁶ Jurkat cells per well were seeded in 6-well plate with RPMI 1640 medium containing 1% fetal bovine serum. Cells were then left untreated or treated with one of the following: 6 μm camptothecin for 6 h, 500 μl of MH43-1 culture supernatant, pure synthetic kleboxymycin for overnight at 37 °C. After incubation, cells were stained with PE annexin V and 7-AAD, and analyzed by flow cytometry.
Author contributions
H. T., K. H. S., and K. Y. Y. conceived and coordinated the study and wrote the paper. D. Y. and Q. G. produced the kleboxymycin via total synthesis. K. H. S., R. Y. T. J., K. C. L., C. W. L., S. Y. L., Y. K., I. K. C., and S. S. C. T. performed LC-MS and NMR characterization on the culture supernatant, and purified and identified the toxin. R. Y.T. K., J. D., E. C., W. M. C., and S. P. L. optimized the toxin-producing conditions and performed cytotoxicity assays and genetic manipulations on the Klebsiella strains. All authors reviewed the results and approved the final version of the manuscript.
Supplementary Material
Acknowledgments
We thank Dr. Wing-Cheong Yam, Pok Man Lai, and other colleagues of the Department of Microbiology, University of Hong Kong, for their technical support.
This work was supported by a donation from Michael Tong and the Providence Foundation in memory of Lui Hac Minh and the Commissioned Research on Control of Infectious Diseases (Phase III) Project Number HKM-15-M06 of the Health and Medical Research Fund under the Food and Health Bureau, the Government of the Hong Kong Special Administrative Region. The authors declare that they have no conflicts of interest with the contents of this article.
This article contains Figs. S1–S13 and Tables S1–S6.
The nucleotide sequence(s) reported in this paper has been submitted to the GenBankTM/EBI Data Bank with accession number(s) MF401554T.
- AAHC
- antibiotic-associated hemorrhagic colitis
- PBD
- pyrrolobenzodiazepine
- DCM
- dichloromethane
- PE
- phycoerythrin
- MTT
- 3-(4,5-dimethylthiazol-2-yl)-2,5-diphenyltetrazolium bromide
- 7-AAD
- 7-amino-actinomycin
- CPE
- cytopathic effect
- PS
- phosphatidylserine
- CE
- collision energy
- EMS
- enhanced MS
- TMSP
- trimethylsilylpropanoic acid
- RT
- retention time
- IDA
- information-dependent acquisition
- DP
- declustering potential
- PLS
- partial least squares
- PCA
- principal component analysis
- EI
- electron-impact
- HMBC
- heteronuclear multiple bond correlation
- HSQC
- heteronuclear single quantum coherence
- MEM
- minimum Eagle's medium
- ACN
- acetonitrile
- EPI
- enhanced production.
References
- 1. Donnenberg M. S. (2014) in Mandell, Douglas, and Bennett's Principles and Practice of Infectious Diseases (Bennett J. E., Dolin R., and Blaser M. J., eds) 8th Ed., pp. 2503–2517, Saunders, Philadelphia [Google Scholar]
- 2. Falagas M. E., and Karageorgopoulos D. E. (2009) Extended-spectrum β-lactamase-producing organisms. J. Hosp. Infect. 73, 345–354 [DOI] [PubMed] [Google Scholar]
- 3. Pitout J. D., Nordmann P., and Poirel L. (2015) Carbapenemase-producing Klebsiella pneumoniae, a key pathogen set for global nosocomial dominance. Antimicrob. Agents Chemother. 59, 5873–5884 [DOI] [PMC free article] [PubMed] [Google Scholar]
- 4. Högenauer C., Langner C., Beubler E., Lippe I. T., Schicho R., Gorkiewicz G., Krause R., Gerstgrasser N., Krejs G. J., and Hinterleitner T. A. (2006) Klebsiella oxytoca as a causative organism of antibiotic-associated hemorrhagic colitis. N. Engl. J. Med. 355, 2418–2426 [DOI] [PubMed] [Google Scholar]
- 5. Beaugerie L., Metz M., Barbut F., Bellaiche G., Bouhnik Y., Raskine L., Nicolas J. C., Chatelet F. P., Lehn N., Petit J. C., and Infectious Colitis Study Group. (2003) Klebsiella oxytoca as an agent of antibiotic-associated hemorrhagic colitis. Clin. Gastroenterol. Hepatol. 1, 370–376 [DOI] [PubMed] [Google Scholar]
- 6. Nemet Z., Szenci O., Horvath A., Makrai L., Kis T., Toth B., and Biksi I. (2011) Outbreak of Klebsiella oxytoca enterocolitis on a rabbit farm in Hungary. The Vet. Rec. 168, 243. [DOI] [PubMed] [Google Scholar]
- 7. Cheng V. C., Yam W. C., Tsang L. L., Yau M. C., Siu G. K., Wong S. C., Chan J. F., To K. K., Tse H., Hung I. F., Tai J. W., Ho P. L., and Yuen K. Y. (2012) Epidemiology of Klebsiella oxytoca-associated diarrhea detected by Simmons citrate agar supplemented with inositol, tryptophan, and bile salts. J. Clin. Microbiol. 50, 1571–1579 [DOI] [PMC free article] [PubMed] [Google Scholar]
- 8. Higaki M., Chida T., Takano H., and Nakaya R. (1990) Cytotoxic component(s) of Klebsiella oxytoca on HEp-2 cells. Microbiol. Immunol. 34, 147–151 [DOI] [PubMed] [Google Scholar]
- 9. Chen J., Cachay E. R., and Hunt G. C. (2004) Klebsiella oxytoca: a rare cause of severe infectious colitis: first North American case report. Gastrointest. Endosc. 60, 142–145 [DOI] [PubMed] [Google Scholar]
- 10. Philbrick A. M., and Ernst M. E. (2007) Amoxicillin-associated hemorrhagic colitis in the presence of Klebsiella oxytoca. Pharmacotherapy 27, 1603–1607 [DOI] [PubMed] [Google Scholar]
- 11. Shinjoh M., Iwata S., and Takahashi T. (2010) Klebsiella oxytoca-positive, penicillin-associated hemorrhagic enterocolitis in children. Pediatr. Int. 52, 132–133 [DOI] [PubMed] [Google Scholar]
- 12. Yilmaz M., Bilir Y. A., Aygün G., Erzin Y., Ozturk R., and Celik A. F. (2012) Prospective observational study on antibiotic-associated bloody diarrhea: report of 21 cases with a long-term follow-up from Turkey. Eur. J. Gastroenterol. Hepatol. 24, 688–694 [DOI] [PubMed] [Google Scholar]
- 13. Sweetser S., Schroeder K. W., and Pardi D. S. (2009) Pseudomembranous colitis secondary to Klebsiella oxytoca. Am. J. Gastroenterol. 104, 2366–2368 [DOI] [PubMed] [Google Scholar]
- 14. Yamada M., Yamazawa K., Sekiguchi S., Shinjoh M., Tomita K., Takenouchi T., and Takahashi T. (2014) A pediatric case of antibiotic-associated hemorrhagic colitis caused by Klebsiella oxytoca. Glob. Pediatr. Health 1, 2333794X14550525. [DOI] [PMC free article] [PubMed] [Google Scholar]
- 15. Minami J., Okabe A., Shiode J., and Hayashi H. (1989) Production of a unique cytotoxin by Klebsiella oxytoca. Microb. Pathog. 7, 203–211 [DOI] [PubMed] [Google Scholar]
- 16. Minami J., Saito S., Yoshida T., Uemura T., and Okabe A. (1992) Biological activities and chemical composition of a cytotoxin of Klebsiella oxytoca. J. Gen. Microbiol. 138, 1921–1927 [DOI] [PubMed] [Google Scholar]
- 17. Schneditz G., Rentner J., Roier S., Pletz J., Herzog K. A., Bücker R., Troeger H., Schild S., Weber H., Breinbauer R., Gorkiewicz G., Högenauer C., and Zechner E. L. (2014) Enterotoxicity of a nonribosomal peptide causes antibiotic-associated colitis. Proc. Natl. Acad. Sci. U.S.A. 111, 13181–13186 [DOI] [PMC free article] [PubMed] [Google Scholar]
- 18. Darby A., Lertpiriyapong K., Sarkar U., Seneviratne U., Park D. S., Gamazon E. R., Batchelder C., Cheung C., Buckley E. M., Taylor N. S., Shen Z., Tannenbaum S. R., Wishnok J. S., and Fox J. G. (2014) Cytotoxic and pathogenic properties of Klebsiella oxytoca isolated from laboratory animals. PLoS ONE 9, e100542. [DOI] [PMC free article] [PubMed] [Google Scholar]
- 19. van den Berg R. A., Hoefsloot H. C., Westerhuis J. A., Smilde A. K., and van der Werf M. J. (2006) Centering, scaling, and transformations: improving the biological information content of metabolomics data. BMC Genomics 7, 142. [DOI] [PMC free article] [PubMed] [Google Scholar]
- 20. Worley B., and Powers R. (2013) Multivariate analysis in metabolomics. Curr. Metabolomics 1, 92–107 [DOI] [PMC free article] [PubMed] [Google Scholar]
- 21. Hurley L. H., and Thurston D. E. (1984) Pyrrolo(l ,4)benzodiazepine antitumor antibiotics: chemistry, iInteraction with DNA, and biological implications. Pharm. Res. 1, 52–59 [DOI] [PubMed] [Google Scholar]
- 22. Mohr N., and Budzikiewicz H. (1982) Tilivalline, a new pyrrolo[2,1-c][1,4]benzodiazepine metabolite from Klebsiella. Tetrahedron 38, 147–152 [Google Scholar]
- 23. Gerratana B. (2012) Biosynthesis, synthesis, and biological activities of pyrrolobenzodiazepines. Med. Res. Rev. 32, 254–293 [DOI] [PMC free article] [PubMed] [Google Scholar]
- 24. Nagasaka T., and Koseki Y. (1998) Stereoselective synthesis of tilivalline. J. Org. Chem. 63, 6797–6801 [DOI] [PubMed] [Google Scholar]
- 25. Takanabe A., Arakawa Y., Kagitani Y., Ueda Y., Satoh D., and Komatsu N. (January 22, 1980) Pyrrolo benzodiazepine compounds. U. S. Patent 4,185,016
- 26. Kim D.-H., Lee J.-H., Bae E.-A., and Han M. J. (1995) Induction and inhibition of indole production of intestinal bacteria. Arch. Pharmacol. Res. 18, 351–355 [Google Scholar]
- 27. Chimerel C., Emery E., Summers D. K., Keyser U., Gribble F. M., and Reimann F. (2014) Bacterial metabolite indole modulates incretin secretion from intestinal enteroendocrine L cells. Cell Rep. 9, 1202–1208 [DOI] [PMC free article] [PubMed] [Google Scholar]
- 28. Kim K., Aronov P., Zakharkin S. O., Anderson D., Perroud B., Thompson I. M., and Weiss R. H. (2009) Urine metabolomics analysis for kidney cancer detection and biomarker discovery. Mol. Cell. Proteomics 8, 558–570 [DOI] [PMC free article] [PubMed] [Google Scholar]
- 29. Chua L. S., Amin N. A., Neo J. C., Lee T. H., Lee C. T., Sarmidi M. R., and Aziz R. A. (2011) LC-MS/MS-based metabolites of Eurycoma longifolia (Tongkat Ali) in Malaysia (Perak and Pahang). J. Chromatogr. B. Analyt. Technol. Biomed. Life Sci. 879, 3909–3919 [DOI] [PubMed] [Google Scholar]
- 30. Wishart D. S., Bigam C. G., Yao J., Abildgaard F., Dyson H. J., Oldfield E., Markley J. L., and Sykes B. D. (1995) H-1, C-13, and N-15 chemical-shift referencing in biomolecular NMR. J. Biomol. NMR 6, 135–140 [DOI] [PubMed] [Google Scholar]
- 31. Datsenko K. A., and Wanner B. L. (2000) One-step inactivation of chromosomal genes in Escherichia coli K-12 using PCR products. Proc. Natl. Acad. Sci. U.S.A. 97, 6640–6645 [DOI] [PMC free article] [PubMed] [Google Scholar]
- 32. Datta S., Costantino N., and Court D. L. (2006) A set of recombineering plasmids for Gram-negative bacteria. Gene 379, 109–115 [DOI] [PubMed] [Google Scholar]
- 33. Buchholz F., Angrand P. O., and Stewart A. F. (1996) A simple assay to determine the functionality of Cre or FLP recombination targets in genomic manipulation constructs. Nucleic Acids Res. 24, 3118–3119 [DOI] [PMC free article] [PubMed] [Google Scholar]
- 34. Zhang Y., Buchholz F., Muyrers J. P., and Stewart A. F. (1998) A new logic for DNA engineering using recombination in Escherichia coli. Nat. Genet. 20, 123–128 [DOI] [PubMed] [Google Scholar]
Associated Data
This section collects any data citations, data availability statements, or supplementary materials included in this article.


