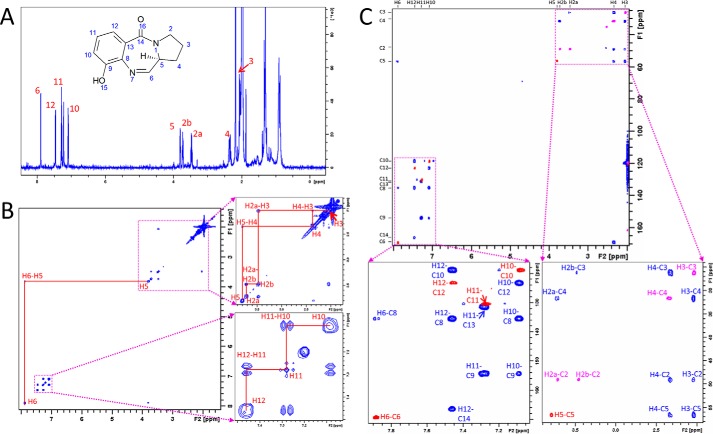
Figure 6.
Resonance assignments of dehydrated kleboxymycin NMR spectra in acetonitrile-d3. A, 1D 1H zg30 spectrum of dehydrated kleboxymycin in acetonitrile-d3 and proton assignments. B, 1H-1H COSY spectrum showing aliphatic protons' (H2–H5) cross-peaks at the region 2–3.8 ppm (right top panel). Aromatic protons' (H10–H12) cross-peaks were observed at the region 7.03–7.51 ppm (right bottom panel). H5 and H6 cross-peaks were also identified. C, 2D 1H-13C HMBC (blue) and HSQC (red for –CH– and pink for –CH2–) overlaid spectrum showing the assignments of carbon without protons attached (C9, C13, and C14).

