Figure 4.
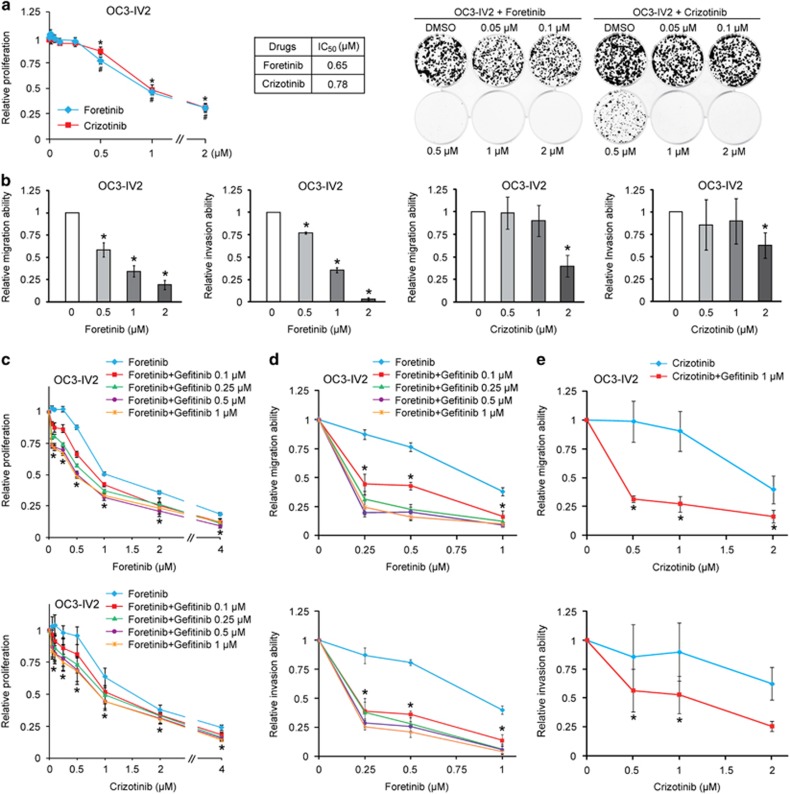
Inhibitor assays for highly invasive OSCC cells. (a) Left: Proliferation of OC3-IV2 cells treated with different concentrations of foretinib or crizotinib for 72 h was measured with the MTT assay. Proliferation was normalized to that of OC3-IV2 cells treated with control (DMSO). *, #Compared with DMSO treatment. IC50 values for foretinib and crizotinib are shown. Right: Colony formation of OC3-IV2 cells treated with different concentrations of foretinib or crizotinib for 12 days; representative images are shown. (b) Cell migration and invasion of OC2-IV2 cells treated with different concentrations of foretinib or crizotinib were quantified with the Boyden chamber assay. (c) Proliferation of OC3-IV2 cells treated with foretinib/crizotinib alone or in combination with the indicated concentrations of gefitinib for 72 h was measured with the MTT assay. *Compared with foretinib or crizotinib alone. (d and e) Migration and invasion of OC3-IV2 cells treated with foretinib (d) or crizotinib (e) alone or in combination with the indicated concentrations of gefitinib were assessed with the Boyden chamber assay. Values for proliferation, migration, and invasion were normalized to those for OC3-IV2 cells treated with DMSO. *Compared with foretinib or crizotinib alone. Data from at least three independent experiments are presented as mean±SEM (*, #P<0.05).

