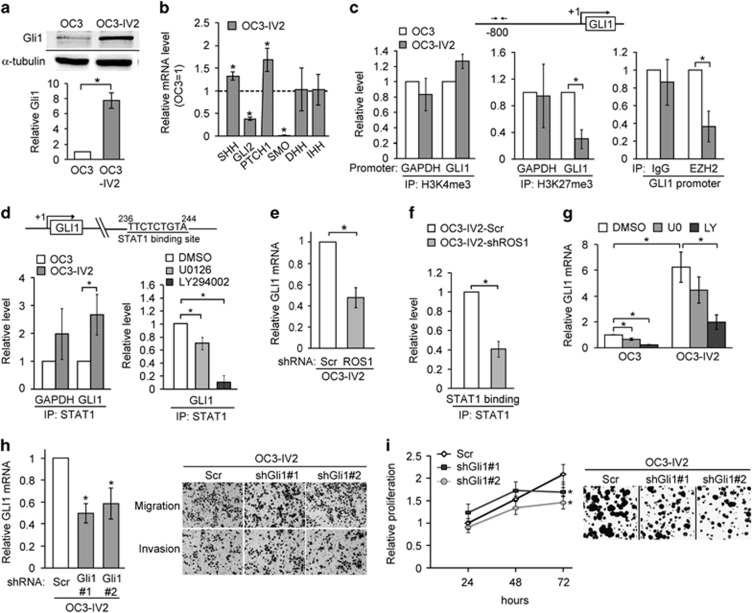
Figure 8.
ROS1-regulated Gli1 level is required for cell proliferation. (a) Western blotting for quantification/comparison of Gli1 level in OC3 and OC3-IV2 cells. (b) The mRNA levels for the indicated genes in OC3-IV2 cells were measured by Q-PCR and normalized to those in OC3 cells. (c) ChIP assays were performed to compare modifications of H3K4me3 and H3K27me3 or EZH2 occupancy of the GLI1 promoter in OC3 and OC3-IV2 cells. (d) Comparison of ChIP assay results for STAT1 occupancy of the GLI1 gene region for OC3 cells, OC3-IV2 cells, and OC3-IV2 cells treated with 20 μM U0126 or LY294002 for 24 h. (e) Q-PCR analysis showing relative GLI1 mRNA expression between OC3-IV2-Scr and OC3-IV2-shROS1#1 cells. (f) STAT1 ChIP assays at the GLI1 gene region were performed using lysates from OC3-IV2-Scr and OC3-IV2-shROS1#1. (g) Relative mRNA level of GLI1 was compared among OC3 and OC3-IV2 cells treated with 20 μM U0126 or LY294002 for 24 h by Q-PCR. (h) Left: Relative mRNA expression from GLI1 between OC3-IV2-Scr, OC3-IV2-shGli1#1, and #2 cells. *Compared with the relative mRNA expression in OC3-IV2-Scr cells. Right: The Boyden chamber assay was used to assess migration and invasion of OC3-IV2-Scr, OC3-IV2-shGli1#1, and #2 cells. (i) Proliferation of OC3-IV2-Scr, OC3-IV2-shGli1#1, and #2 cells was assessed by MTT and colony formation assays. *Compared with OC3-IV2-Scr cells at the indicated time point. Data from at least three independent experiments are presented as mean±SEM (*P<0.05).

