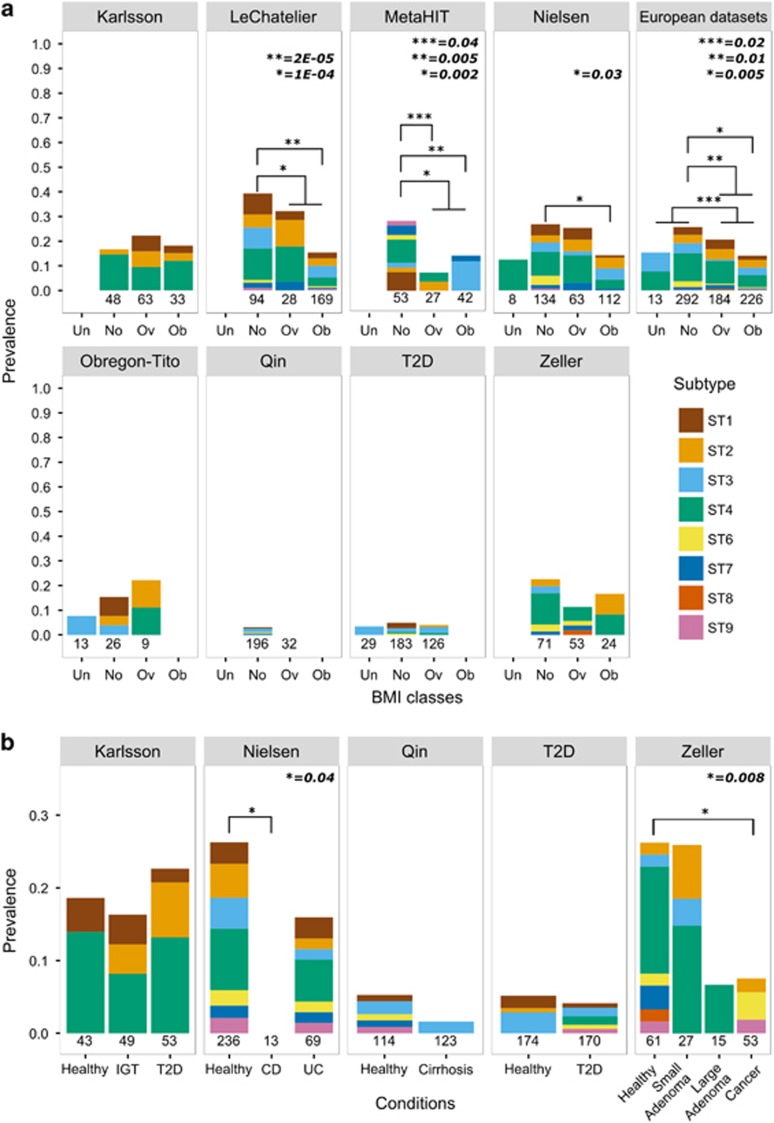
Figure 2.
Blastocystis prevalence in BMI classes (a) and different health conditions (b) for the considered data sets. Barplots show the prevalence of Blastocystis in different health conditions reported in the analyzed data sets. BMI classes considered were underweight (Un), normal (No), overweight (Ov) and obese (Ob). The total number of samples in each class and data set is reported below the bars. Bars associated with a total number of samples less than four are not shown. Note that scales in panels A and B are different. Abbreviations: CD, Crohn’s disease; IGT, impaired glucose tolerance; T2D, type 2 diabetes; UC, ulcerative colitis. Fisher's exact test was used as statistical significance test.

