
Figure 2.
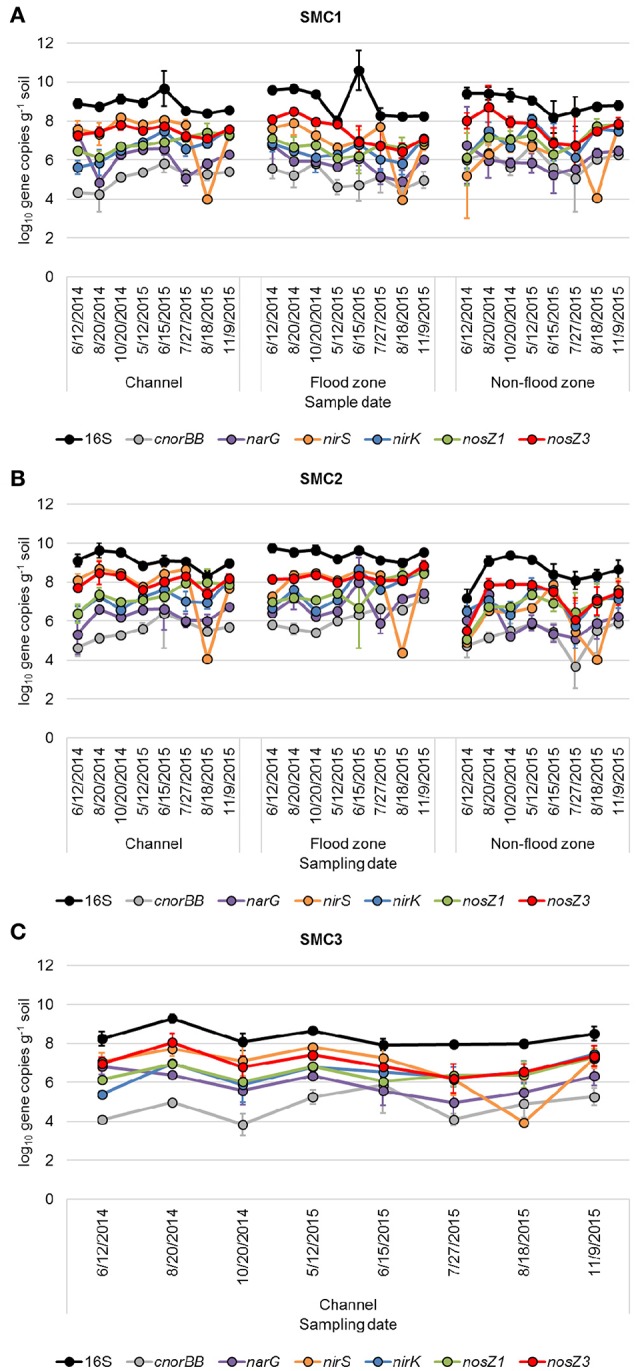
16S rRNA and denitrification gene abundances from samples collected at (A) SMC1, (B) SMC2, and (C) SMC3. Error bars reflect standard deviation of triplicate samples.
Official websites use .gov
A
.gov website belongs to an official
government organization in the United States.
Secure .gov websites use HTTPS
A lock (
) or https:// means you've safely
connected to the .gov website. Share sensitive
information only on official, secure websites.
16S rRNA and denitrification gene abundances from samples collected at (A) SMC1, (B) SMC2, and (C) SMC3. Error bars reflect standard deviation of triplicate samples.