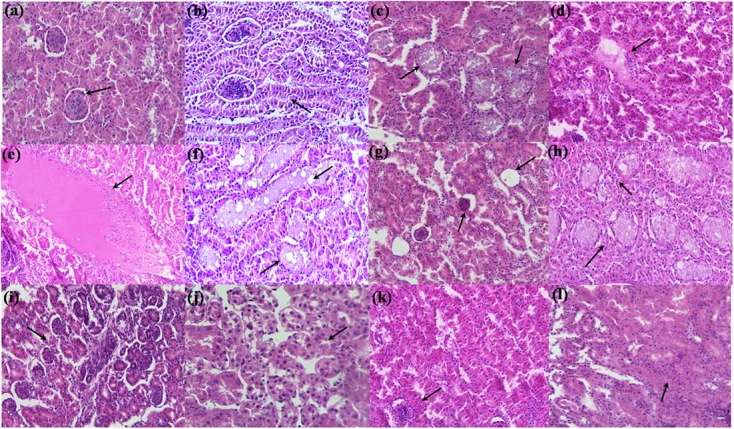
FIGURE 4.

Hematoxylin-eosin stained photomicrographs of kidney of control and treatment broilers. (a,b) Control, (c,d) TOXB + 200 mg FB1, (e–h) 200 mg FB1 alone, (i,j) L. plantarum MYS6 alone, and (k,l) LpMYS6 + 200 mg FB1. Kidney sections were observed at 400× magnification.
