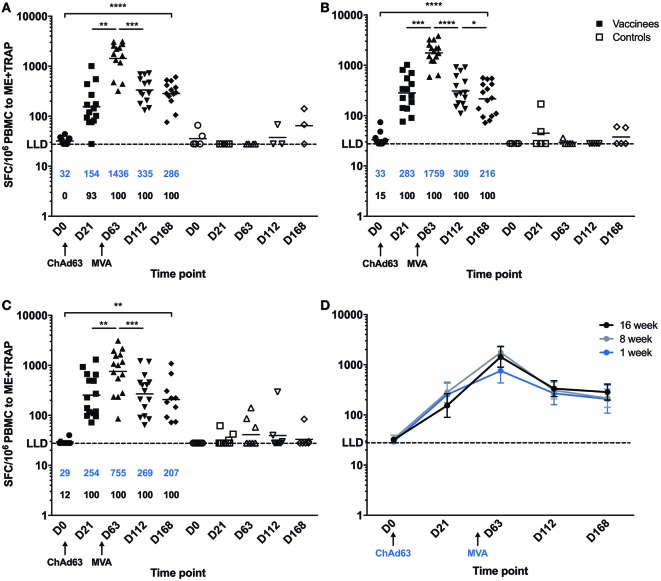
Figure 2.
Ex vivo IFNγ enzyme-linked immunospot responses to multiple epitope string thrombospondin-related adhesion protein (ME-TRAP) pre- and post-vaccination with ChAd63 and MVA ME-TRAP in Gambian infants. (A–C) Scatter plots show individual responses to ME-TRAP in both vaccinees (in black) and controls (in white) of each age group. (A) 16-week-old; (B) 8-week-old; (C) 1-week-old infants. (D) Geometric mean ME-TRAP responses in each age group over period of follow-up. LLD, lower limit of detection of the assay. Increases in responses over the time course were analyzed using two-tailed Friedman test. Responses between individual time points were compared within each age group using two-tailed Wilcoxon analysis, *p < 0.05, **p < 0.01, ***p < 0.001, ****p < 0.0001. Lines and numbers in blue denote geometric mean. Numbers shown in black represent the percentage of responders among the vaccinated infants for each time point.

