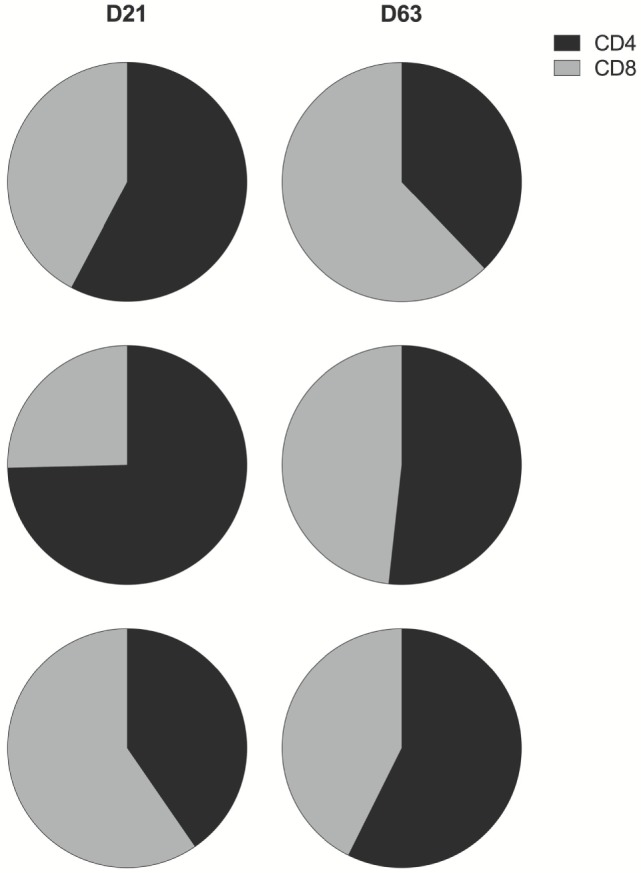
Figure 5.

CD4+ and CD8+ T cell contribution to total IFNγ response to thrombospondin-related adhesion protein (TRAP). Pie charts display the proportion of IFNγ produced by CD4+ (black) and CD8+ (gray) T cells as a fraction of the total IFNγ response to TRAP post-prime and post-boost vaccination. Here, any negative response was excluded from analysis.
