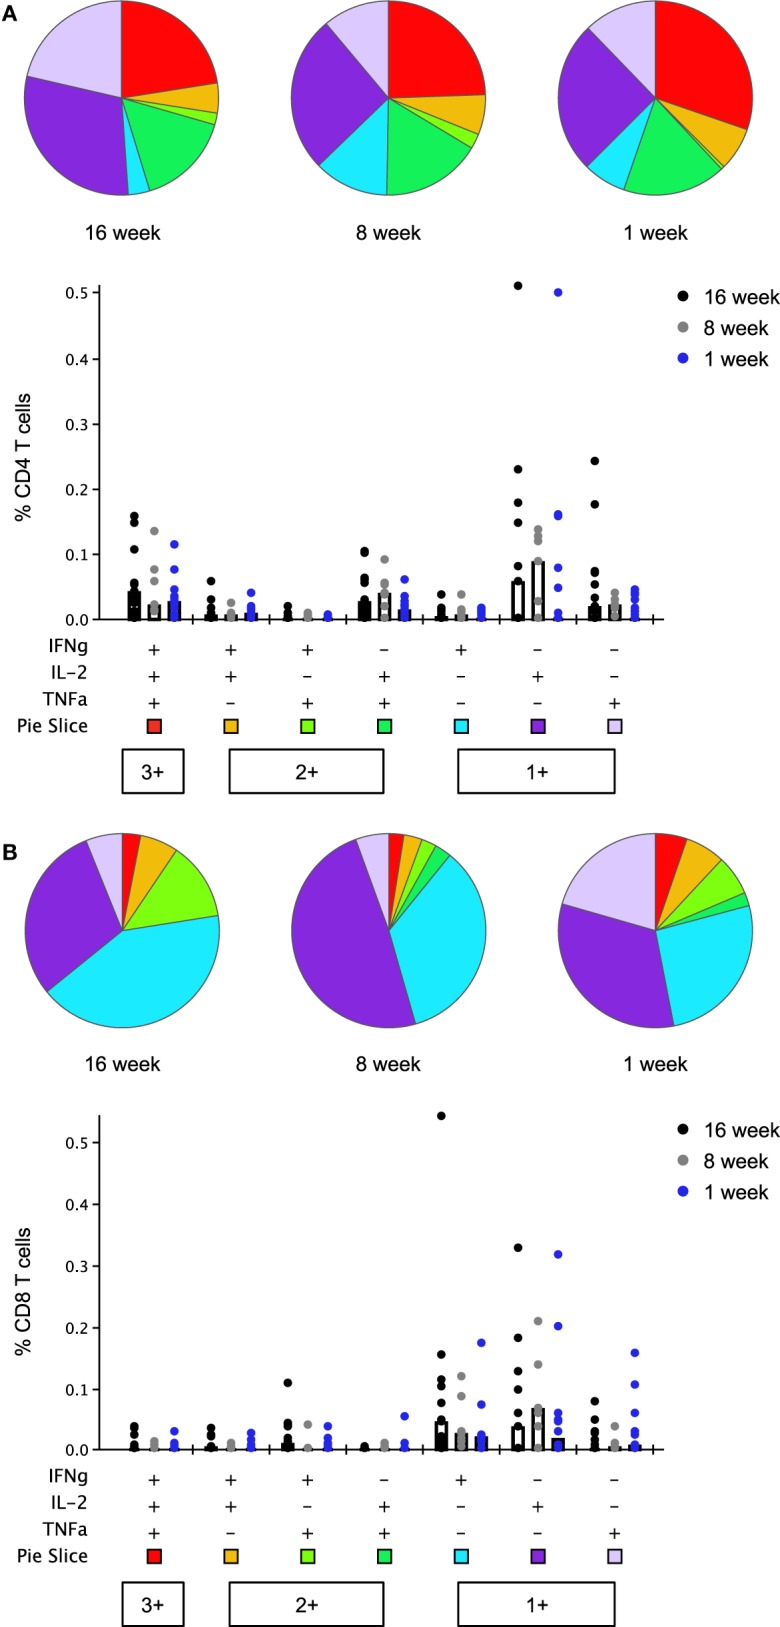
Figure 6.

Multifunctionality of peak CD4+ and CD8+ T cell responses to thrombospondin-related adhesion protein (TRAP) at day 63 (1 week post-boosting). Cytokine production from CD4+ (A) and CD8+ (B) T cells was analyzed using Boolean gating analysis. Pie charts illustrate the relative frequency of each combination of cytokines, indicated in the bar chart below, as a fraction of the total cytokine response. Bar charts show the absolute frequency of each subset in response to stimulation with TRAP peptides, compared between each age group. Bars show median responses in this case as geometric mean is not available in SPICE. Any response which was less than or equal to the background (unstimulated) response was replaced by lower limit of detection value in bar chart and excluded from pie charts.
