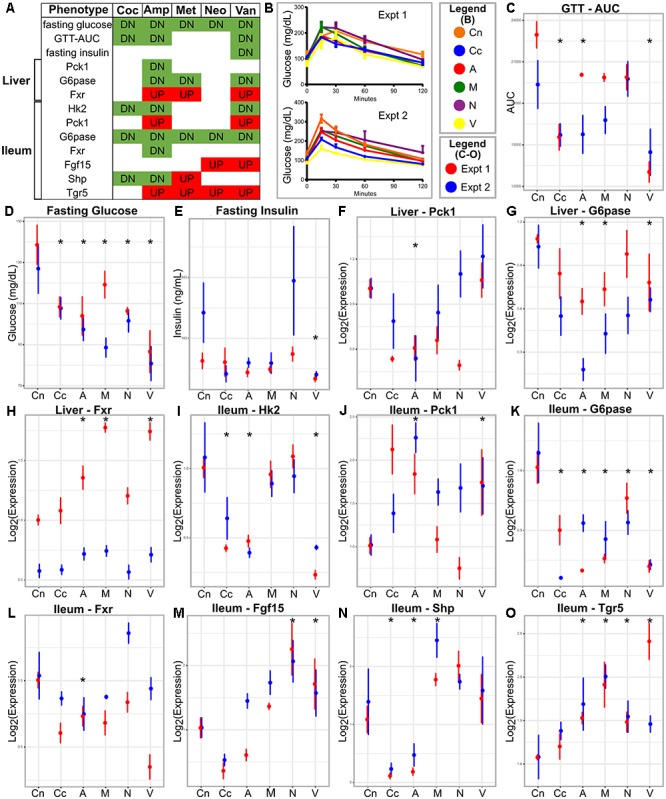
FIGURE 1.

Metabolic parameters and gene expression in antibiotic-treated and control animals. (A) Summary table; the red and green colors indicate increase and decrease, respectively, in antibiotic treated group compared to the control. (B) GTT curves for the antibiotics treated and control groups in the two experiments. (C–E) Metabolic parameters and gene (F–O) expression represented as means with standard error bars. The red and blue colors indicate experiments one and two, respectively. Asterisks indicate parameters that show statistically significant differences upon antibiotics treatment compared to untreated control mice [same direction of (abx/control) fold change in both experiments, individual p-value < 20% in each experiment, Fisher’s combined p-value < 5% and FDR < 10%]. Cn, Control; Coc or Cc, cocktail; Amp or A, ampicillin; Met or M, metronidazole; Neo or N, neomycin; Van or V, vancomycin.
