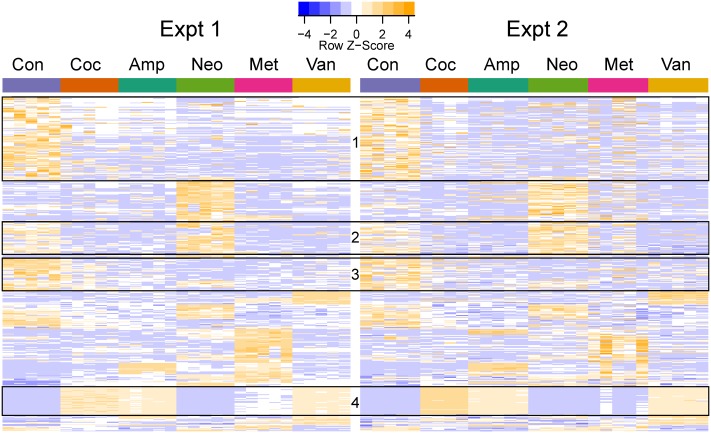
FIGURE 4.
Heatmap of differentially abundant OTUs in the different groups. The represented OTUs passed the same statistical criteria as that used for phenotypes. The rows (OTUs) were clustered based on the abundance in the first experiment and the same row order was used for the second experiment. The rows were scaled, and orange and blue colors indicate increased and decreased abundance, respectively. The ids and taxa names for the rows (OTUs) are provided in Supplementary Table S3. The boxes indicate OTU clusters with the same taxonomy: Boxes 1 (113/117), 2 (43/46), and 3 (43/45) primarily contained Clostridiales (phylum: Firmicutes), while Box 4 (38/38) had Enterobacteriales (phylum: Proteobacteria).

