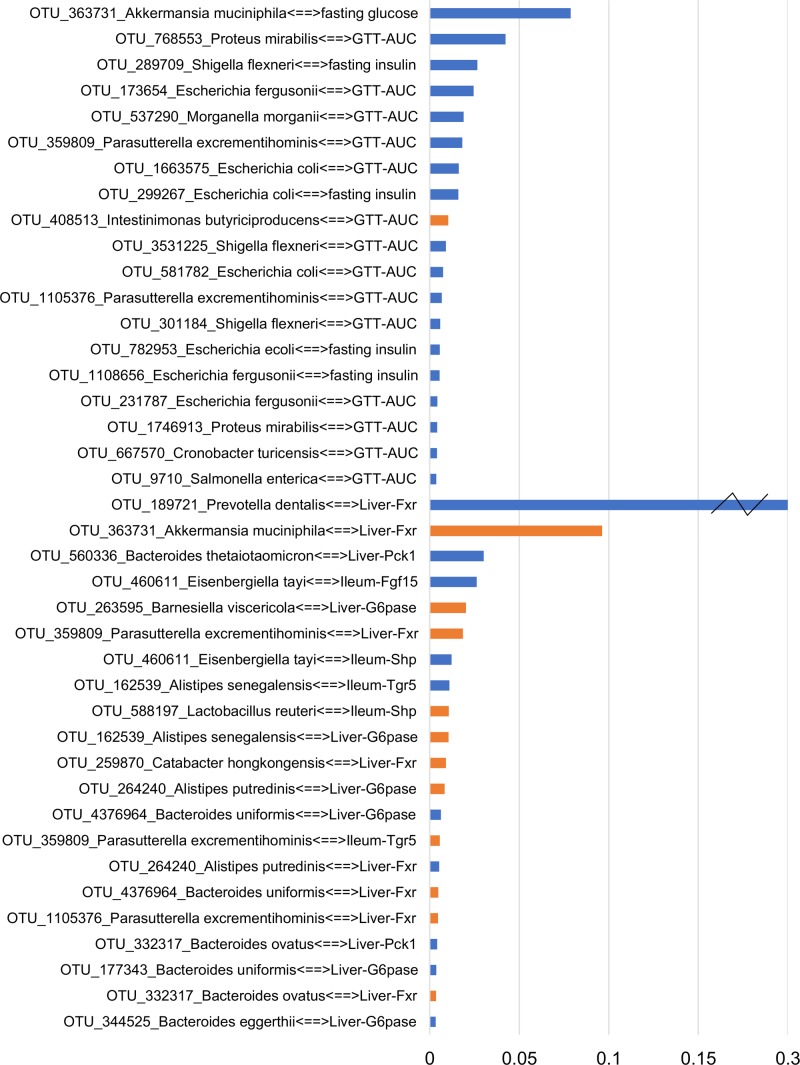
FIGURE 6.
Ranking the transkingdom edges. The score accounts for the bacterial abundance and its correlation strength with a phenotype. Blue and orange colors indicate negative and positive correlated edges, respectively. A broken axis (indicated by “Z”) allows for clear visualization of the other pairs.

