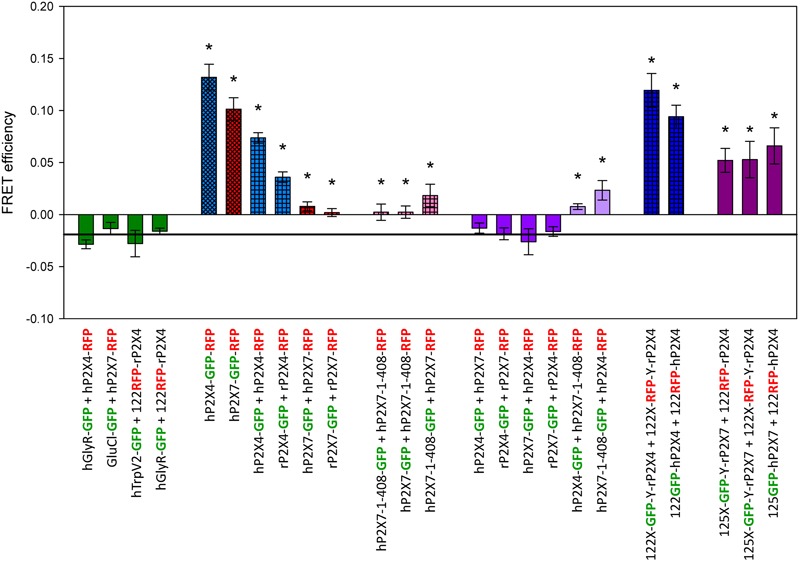
FIGURE 3.

Förster resonance energy transfer measurement of P2X4 and P2X7 subunit interactions. FRET efficiencies were calculated as described in Figure 2. Horizontal line represents GFP bleaching during acceptor bleaching leading to negative FE values of –0.019 (see Figure 2B). ∗, FRET efficiencies significantly larger than –0.019. Data are the means ± SEM from 12–20 oocytes. X and Y denote short, flexible linkers (-GAGA- and -AGAG-, respectively; single amino acid letter code) flanking the GFP or RFP moiety. The position of the fluorophore name indicates the position of the label in the P2X receptor fusion construct (i.e., P2X7-GFP indicates a C-terminal label). Bar colors: green = negative control, blue = P2X4 constructs, red = P2X7 constructs, pink = P2X4/P2X7 coexpression. Bar patterns: cross-hatched = tandem GFP-RFP label, checkered = positive controls.
